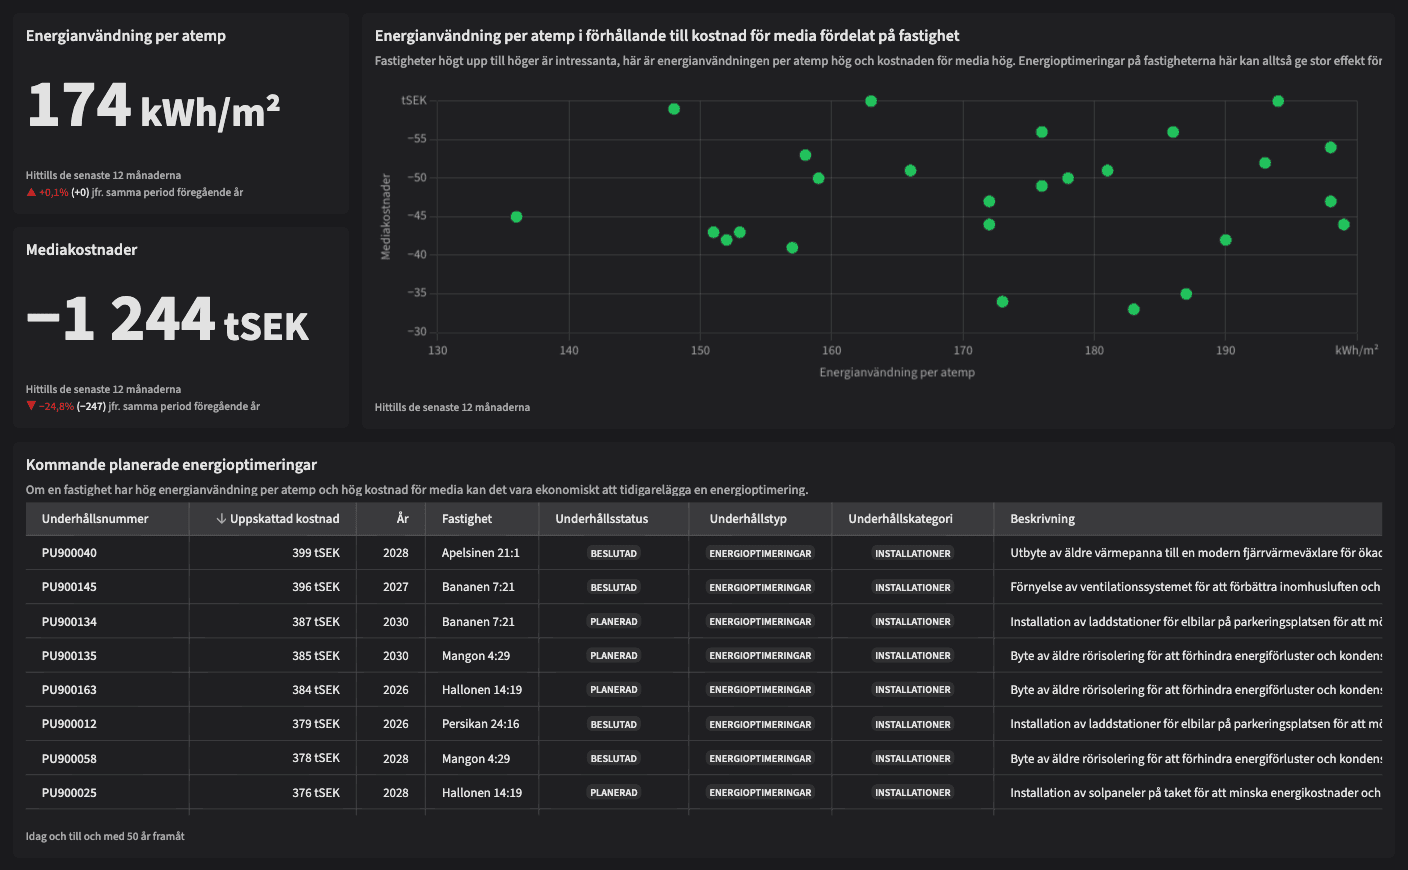
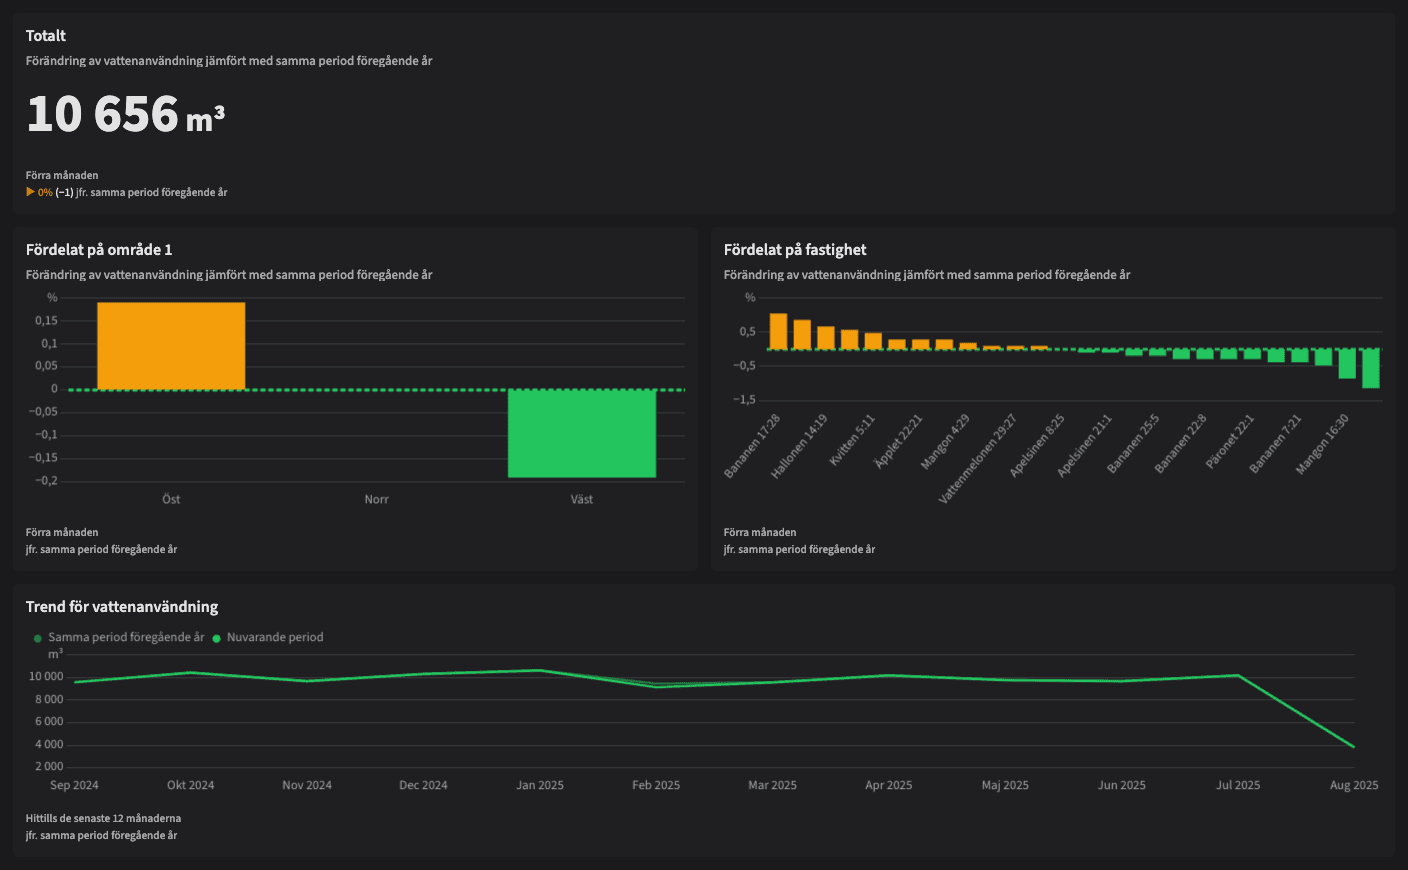
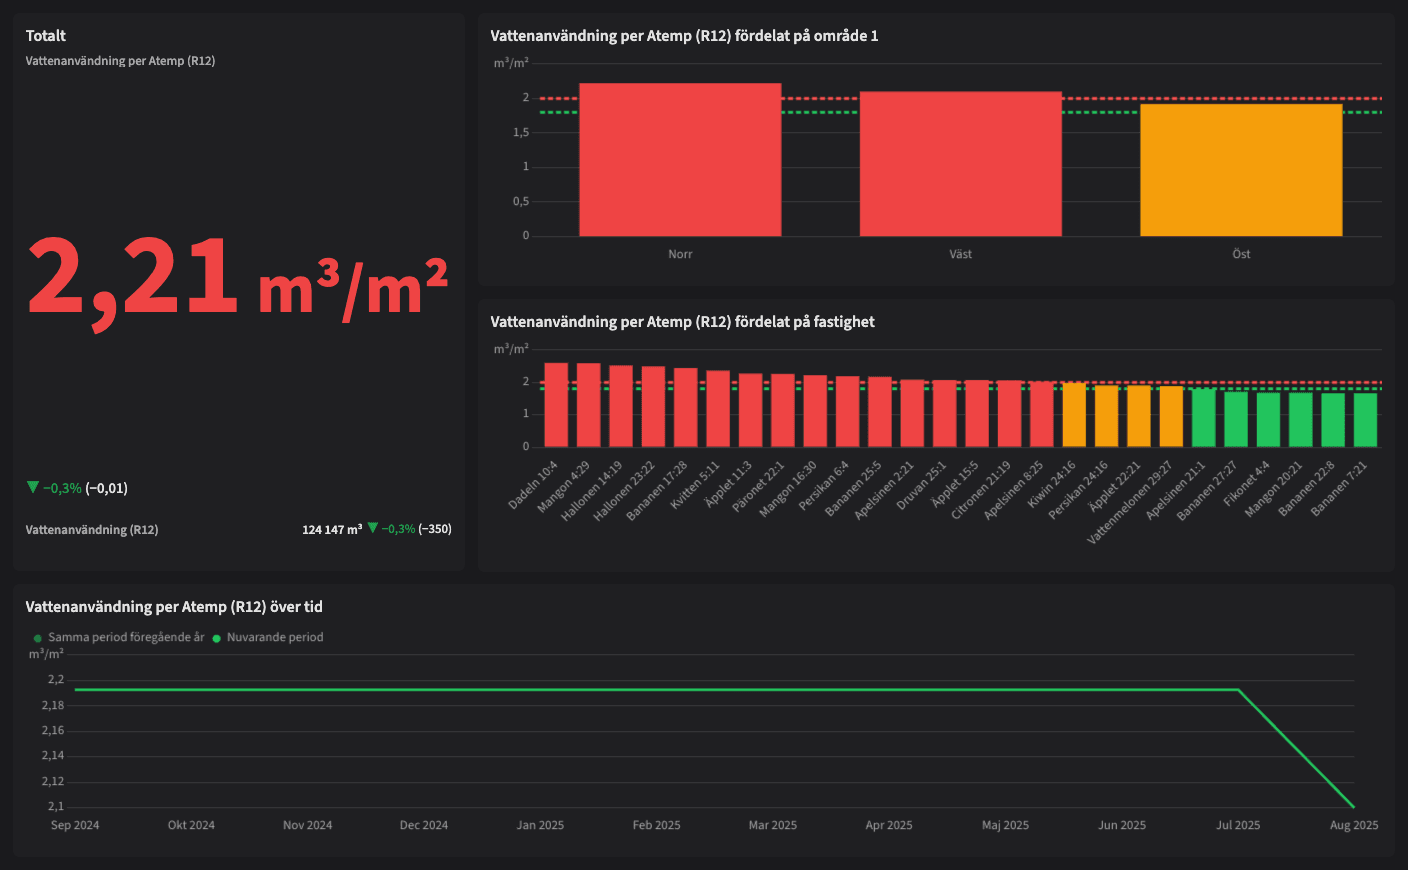
Water Usage Comparison allows users to track and analyze water consumption by property, both in total and relative to heated area (R12). Users can compare water usage between properties in a comparable manner to identify those with the highest consumption, enabling actions to reduce water usage. The dashboard also displays trends over time and includes water consumption costs, providing a comprehensive view of water usage and its financial impact.
This overview helps property owners and managers identify opportunities for efficiency improvements and develop better practices for managing water consumption.
| Vem tittar på den? | Sustainability Manager, Property Manager |
|---|---|
| Hur ofta? | Monthly |
Tips!
Don't forget the absolute numbers! Relative numbers (per Atemp) are good for comparing properties with each other. But in the end, it is optimizations in properties in large absolute numbers that make the biggest difference to the economy and the climate.
Exempel på anslutningar