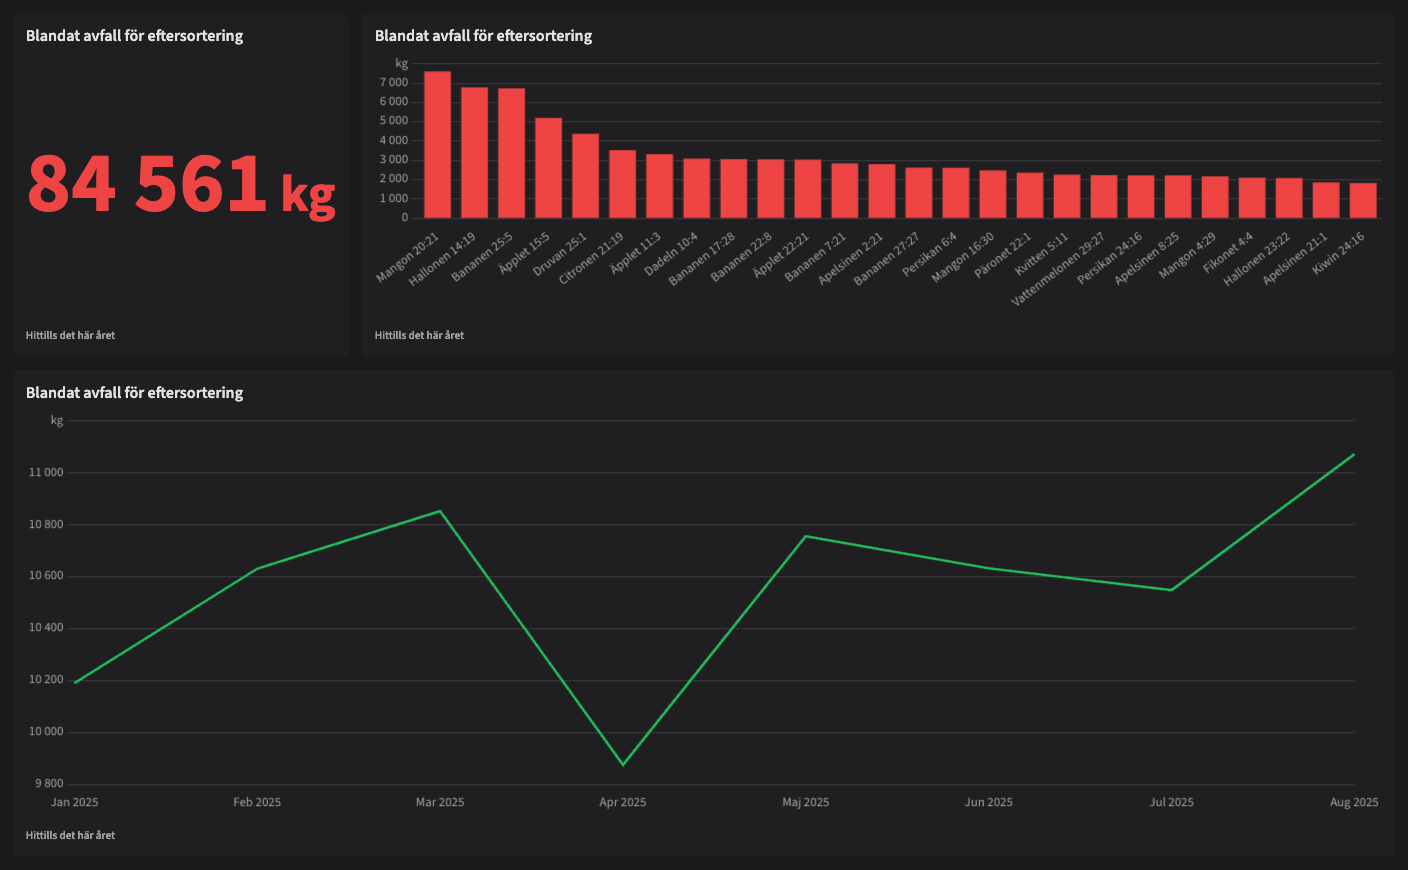
Dashboards
Automated follow-up
within sustainability
Visualize your performance and spot trends faster, uncover new insights, make better decisions, and share your performance with anyone. Activate ready-made dashboards or build your own from scratch.
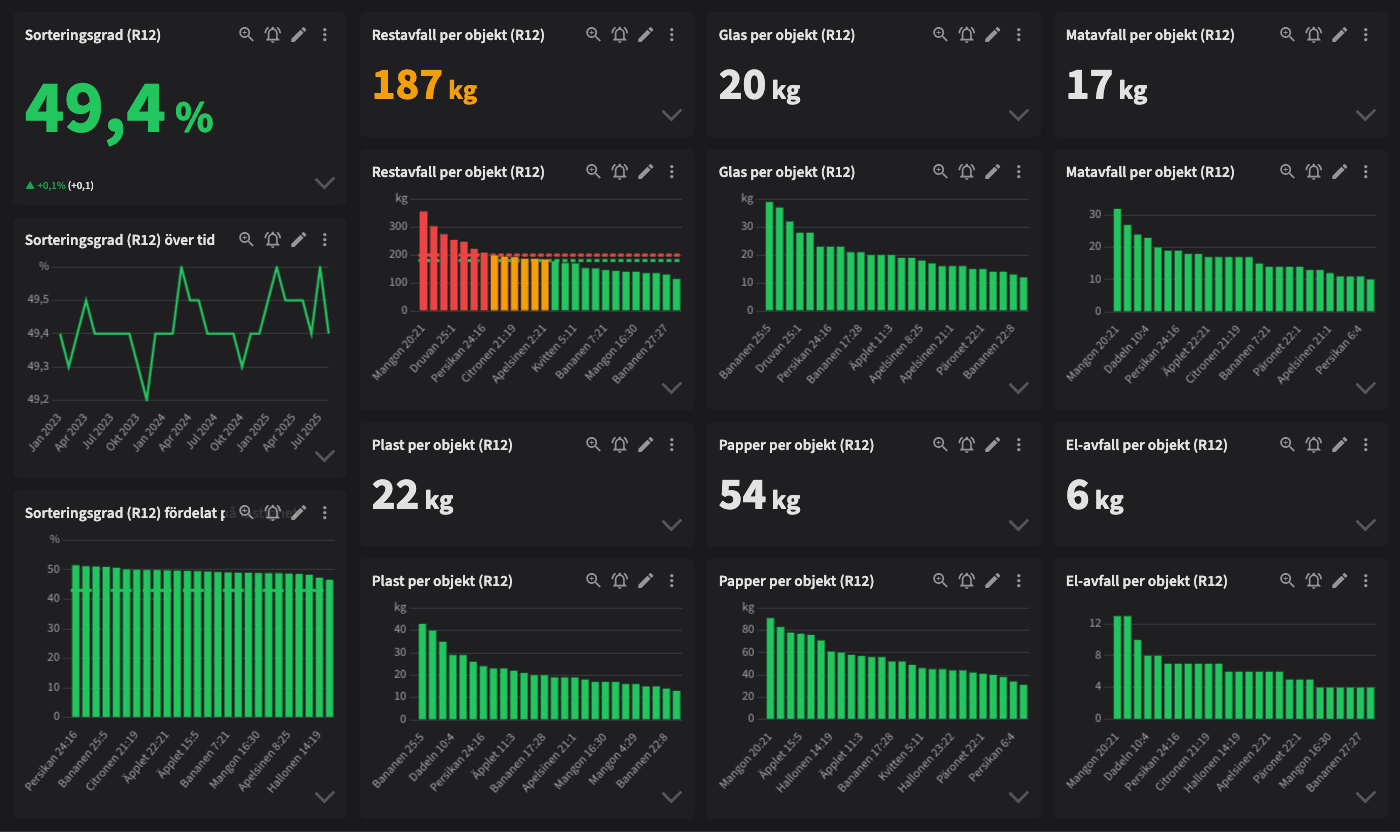
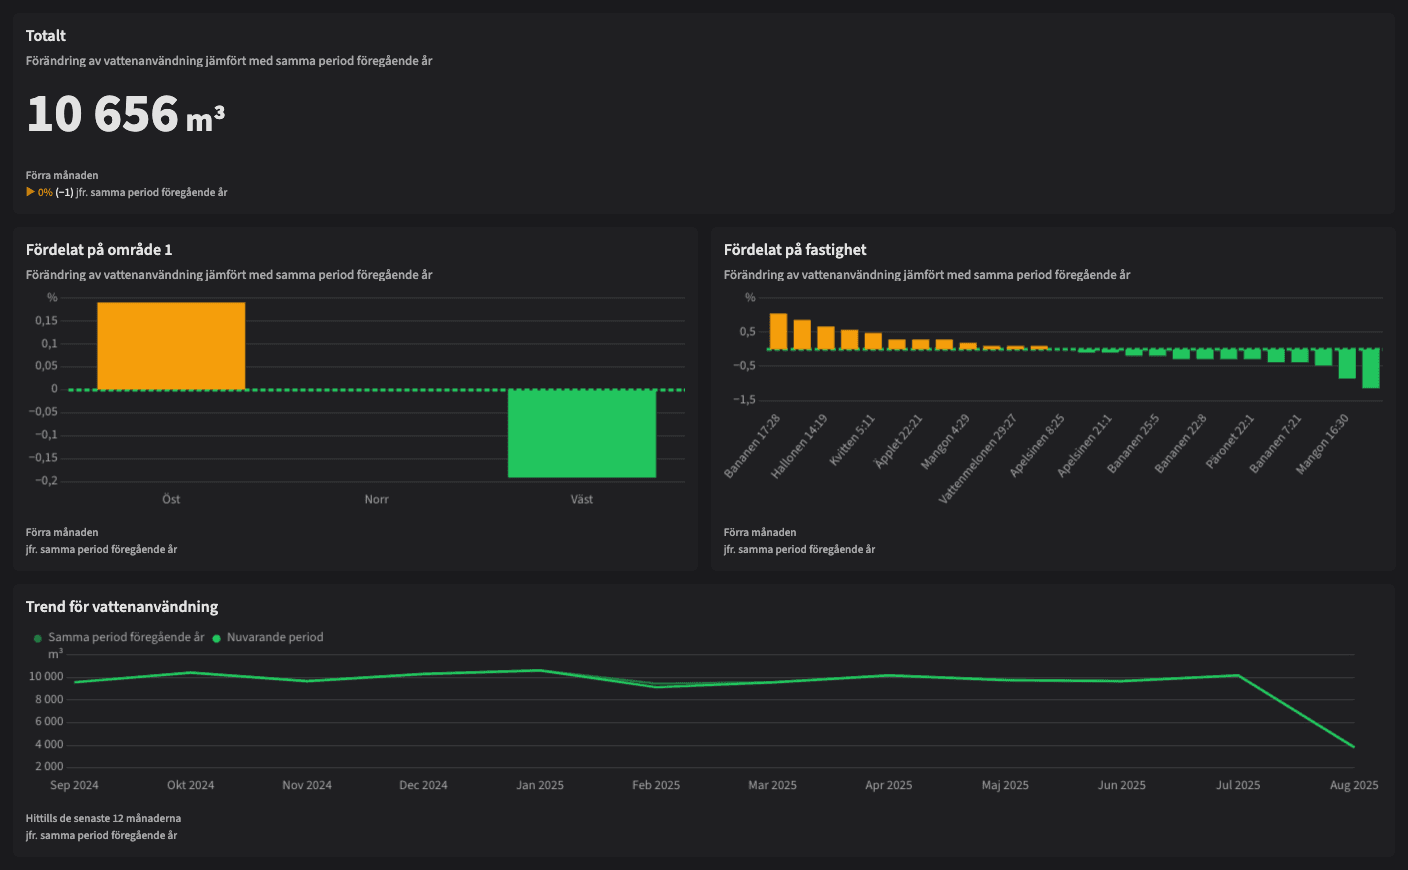
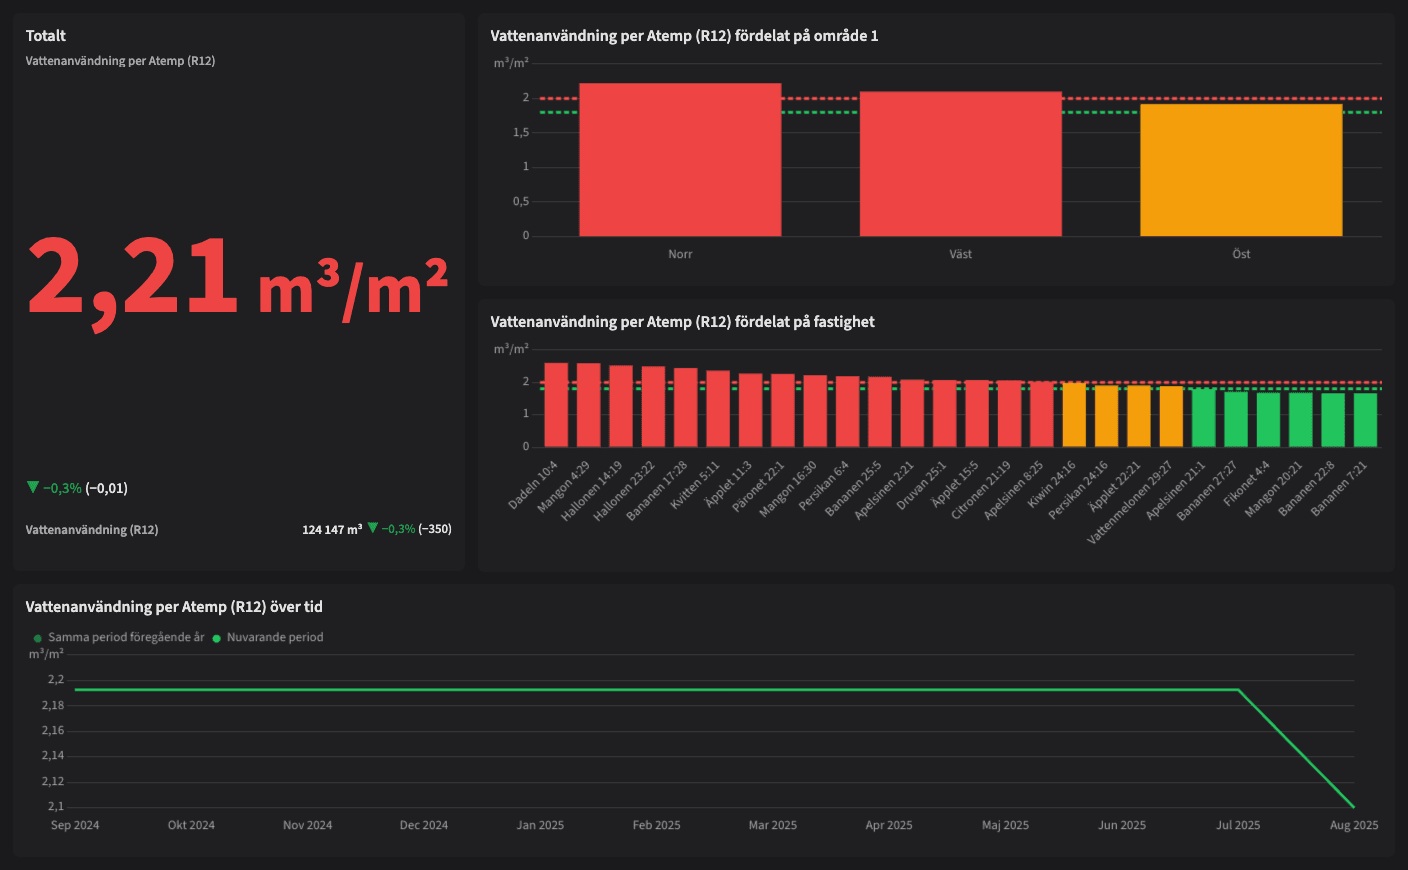
Examples from your industry colleagues
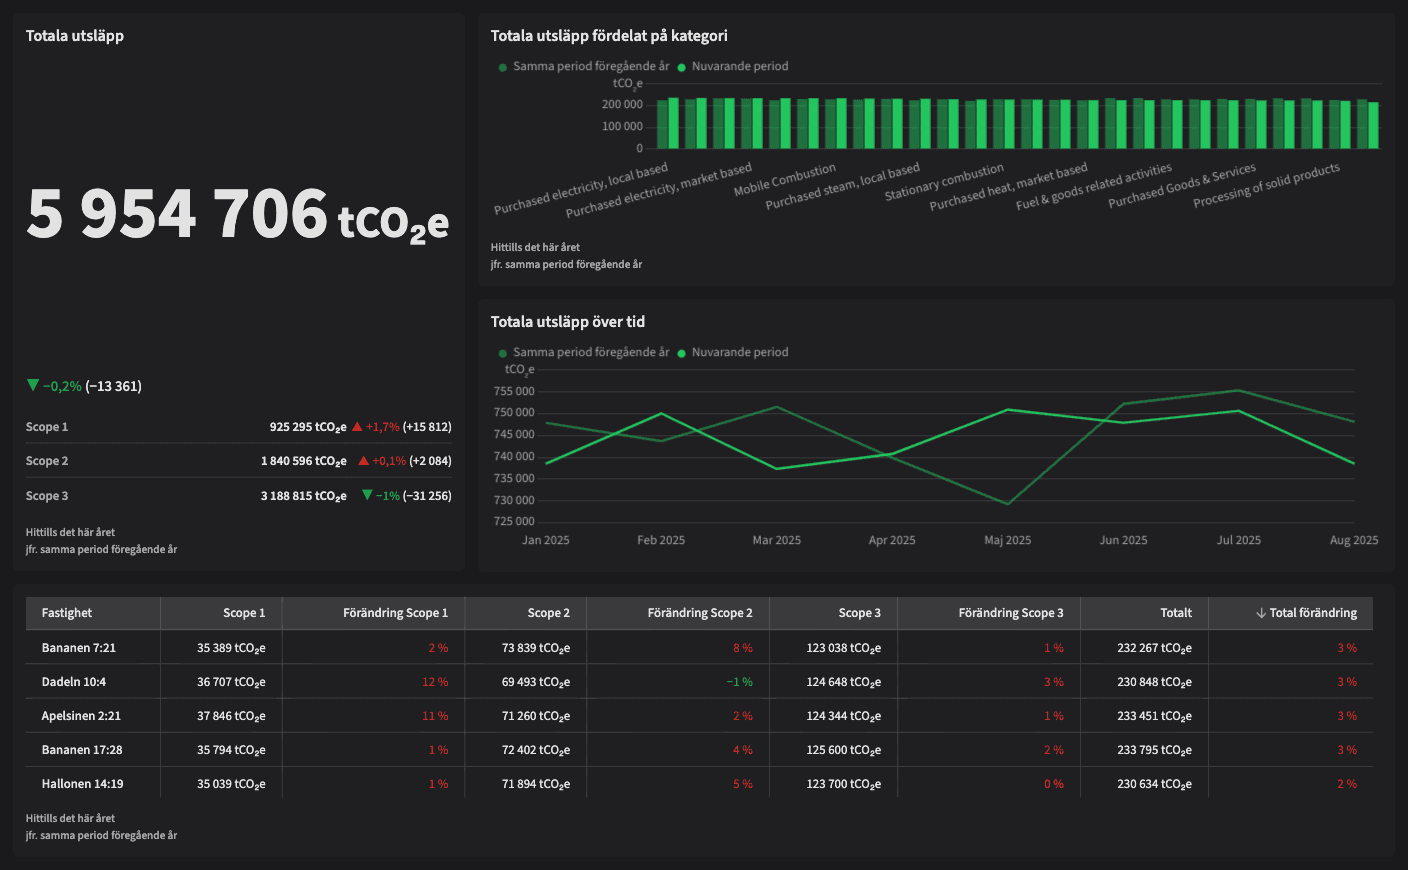
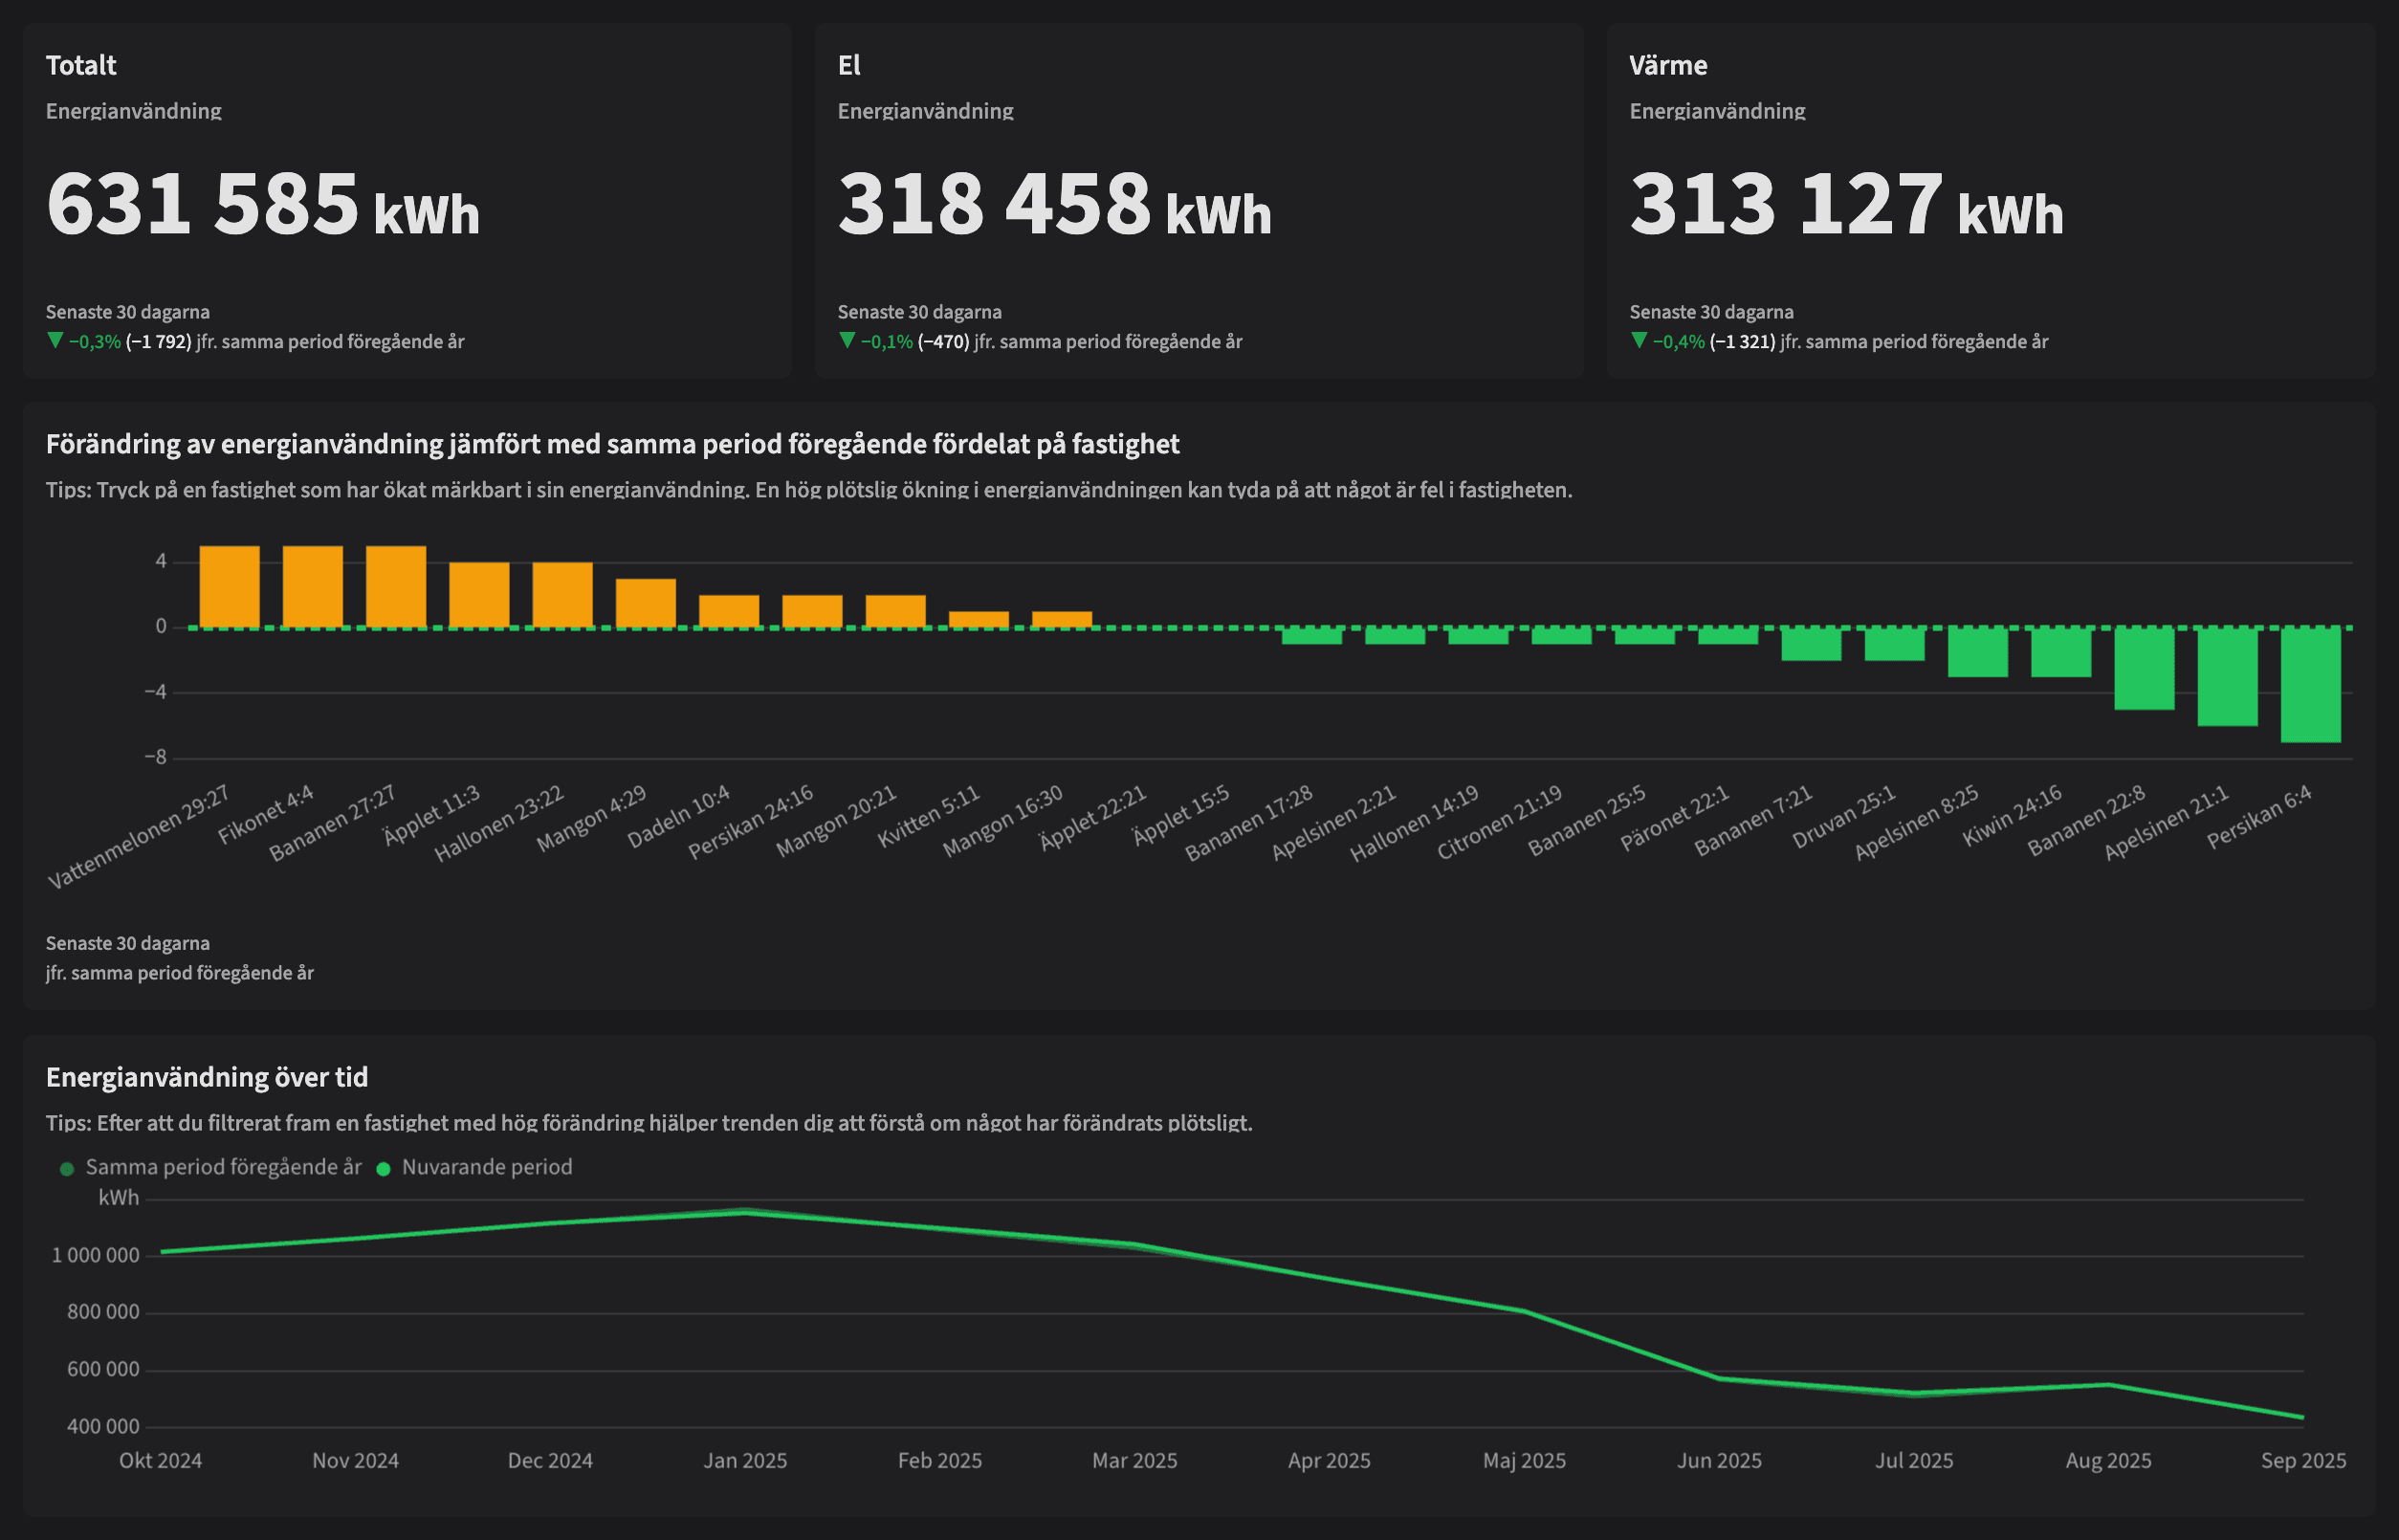
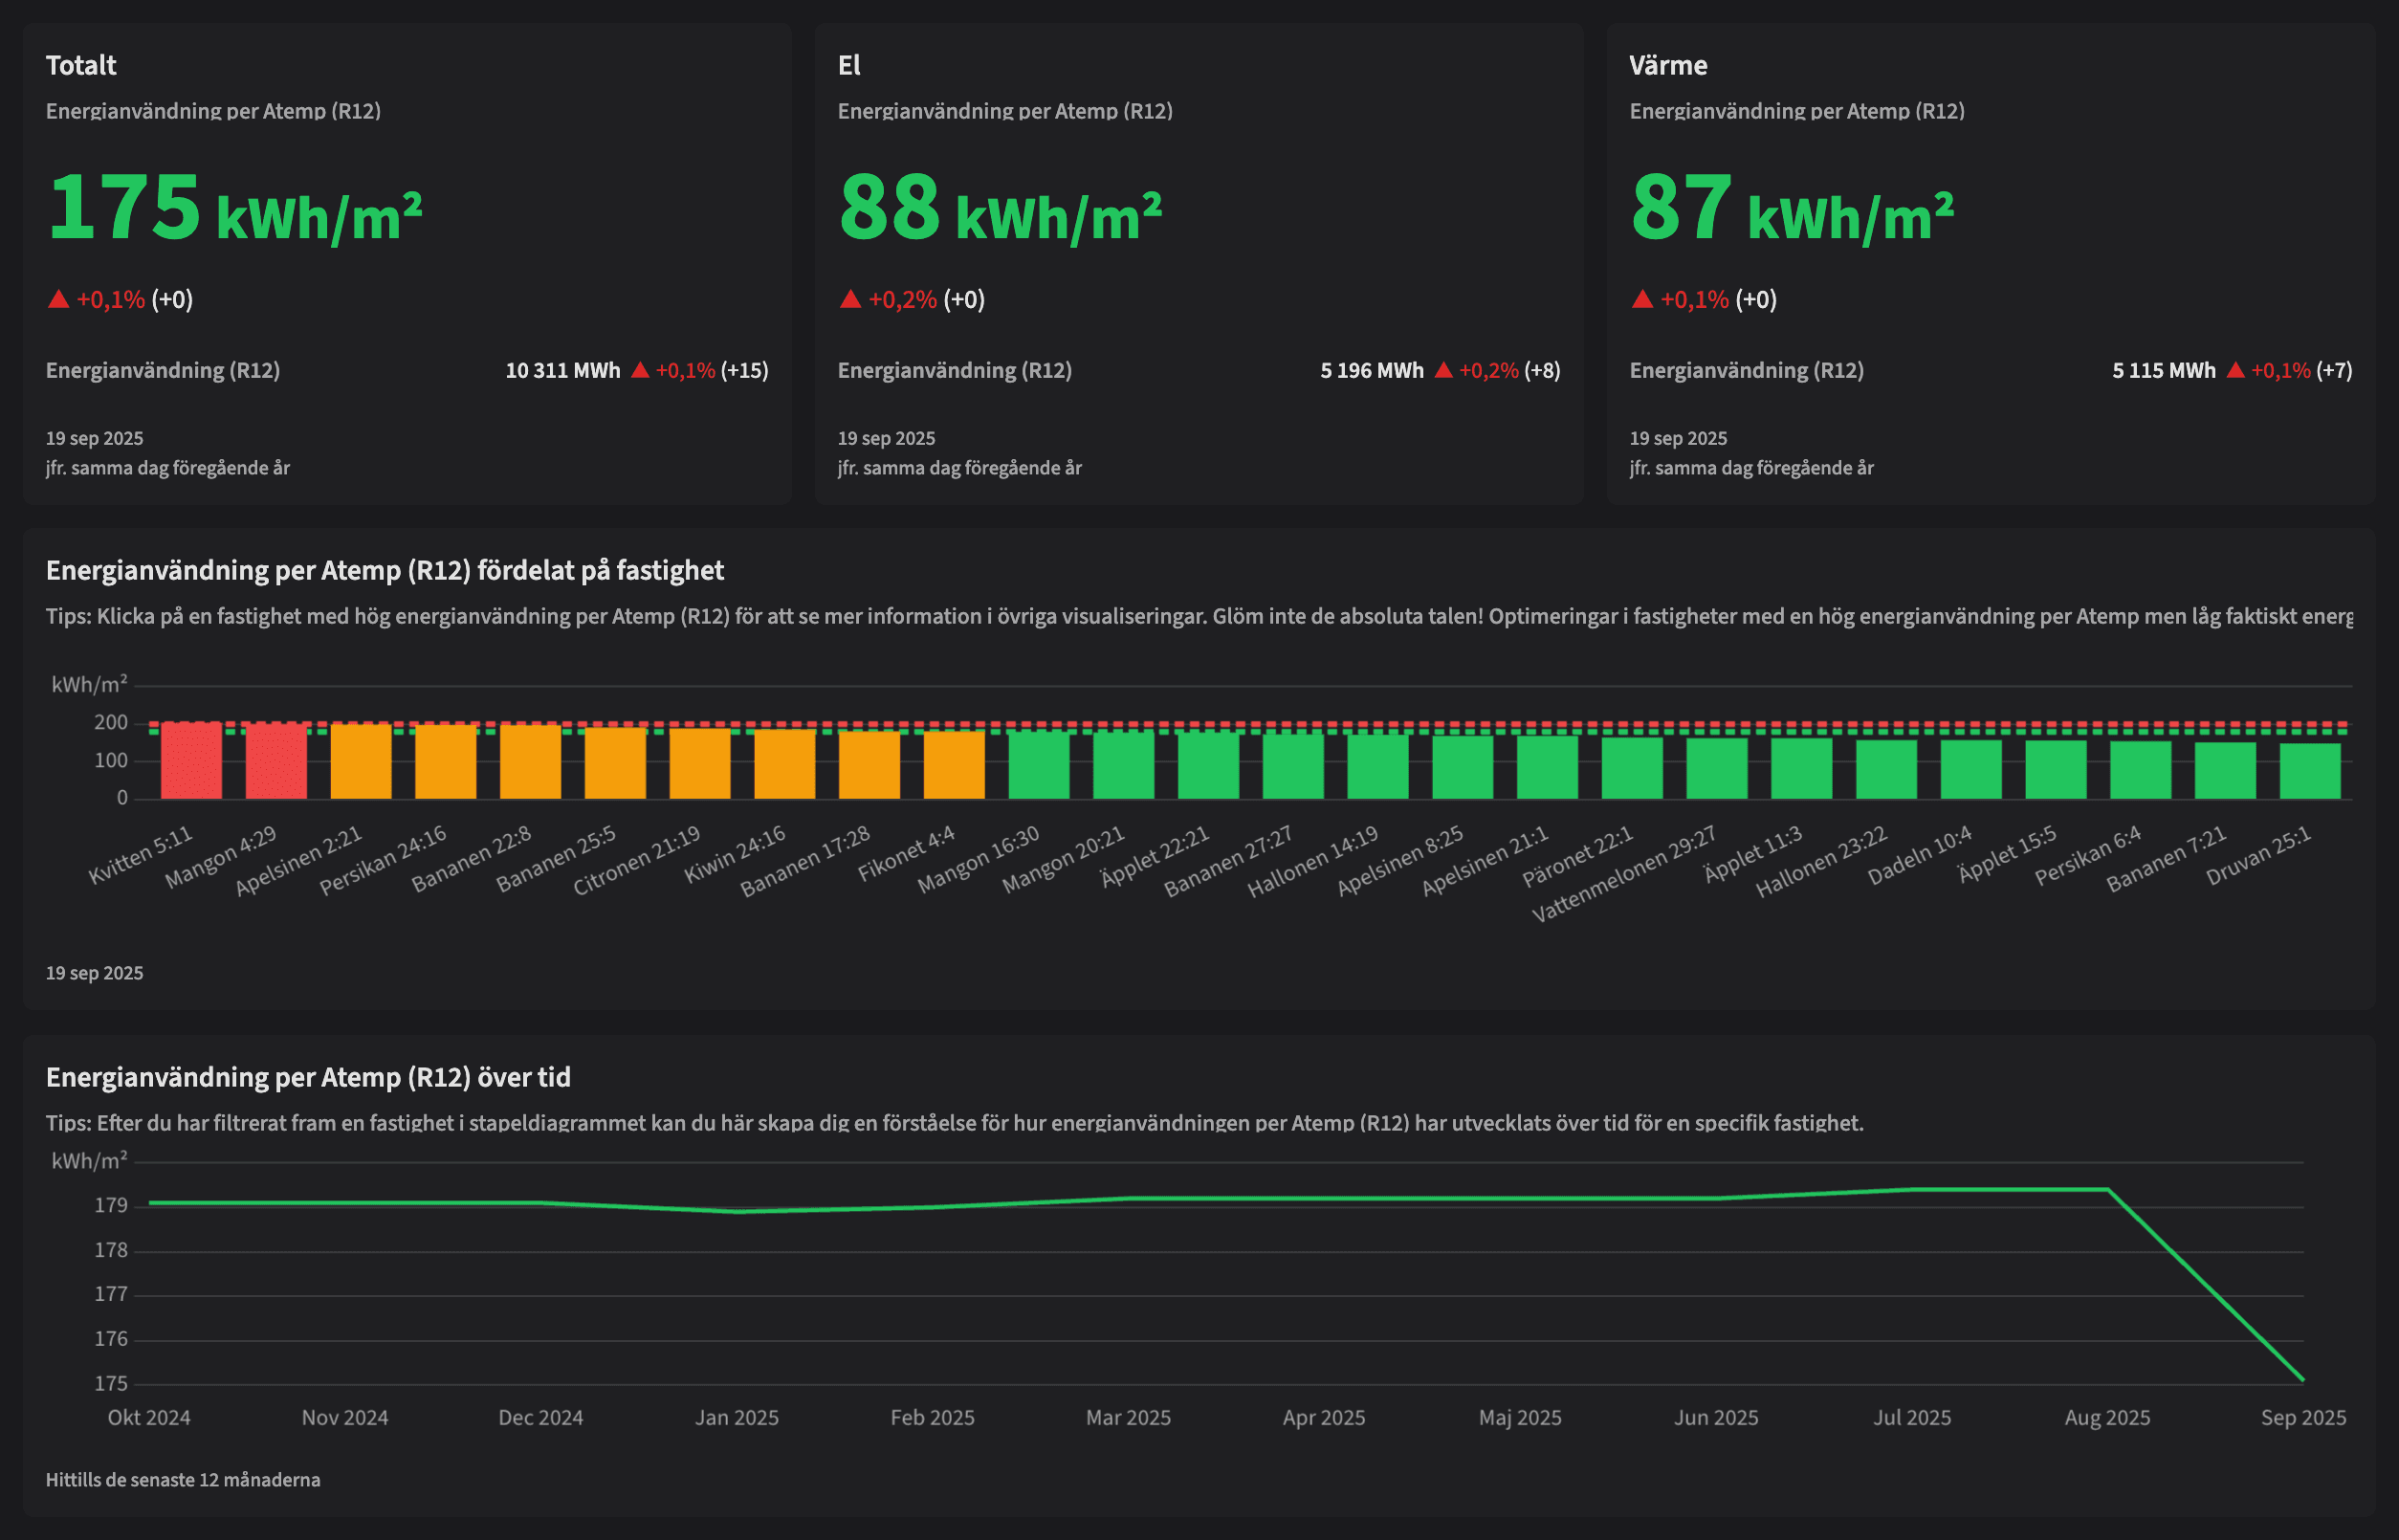
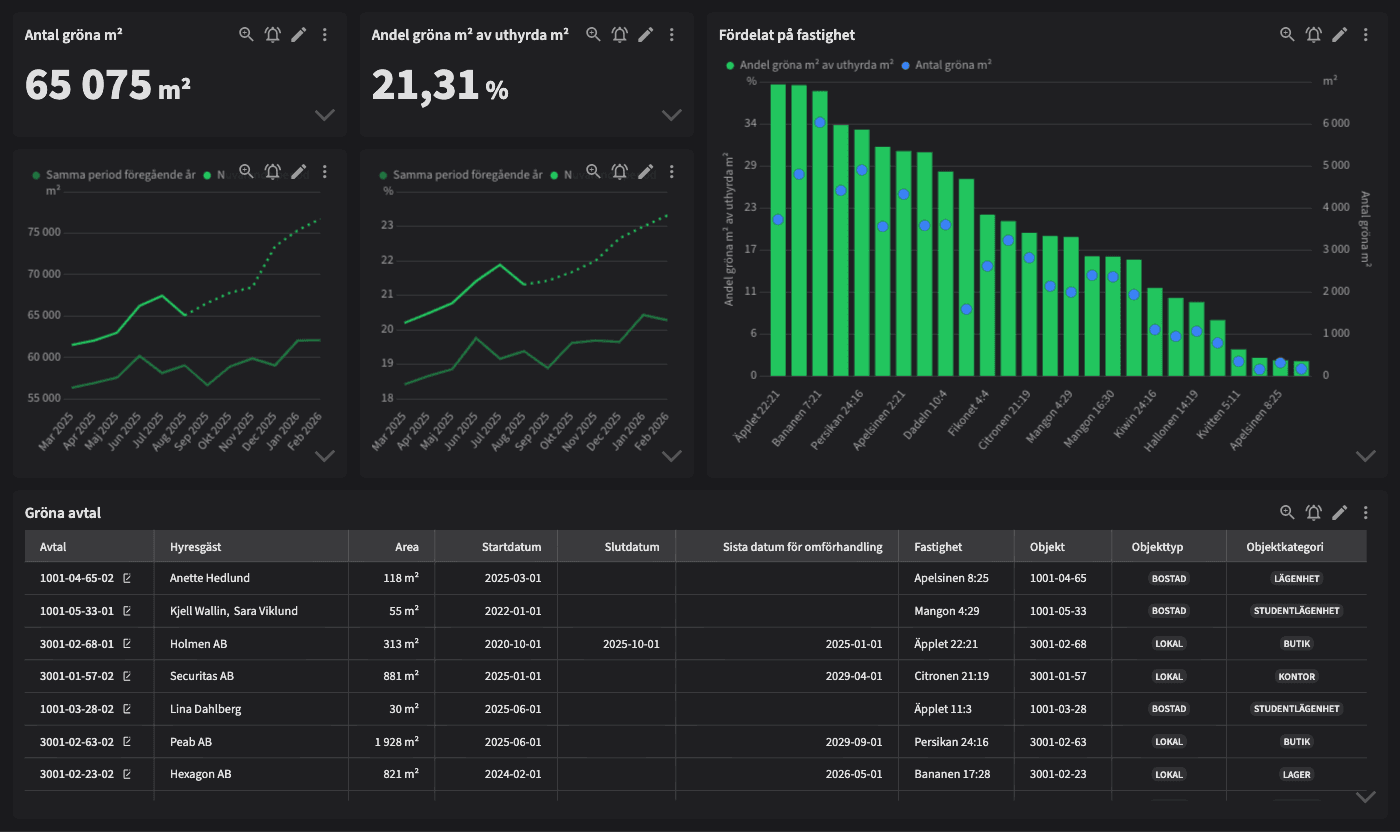
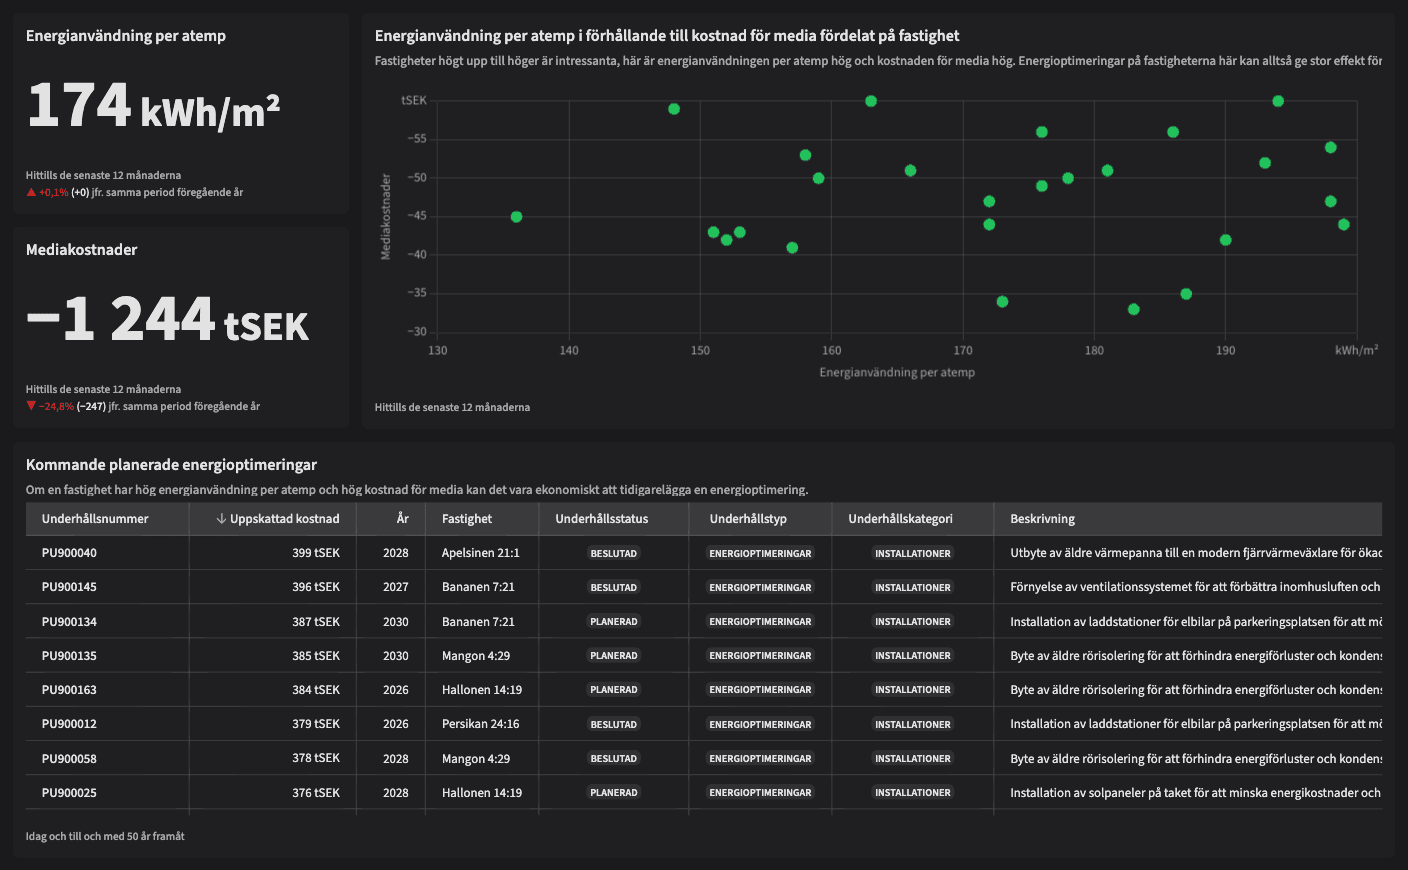
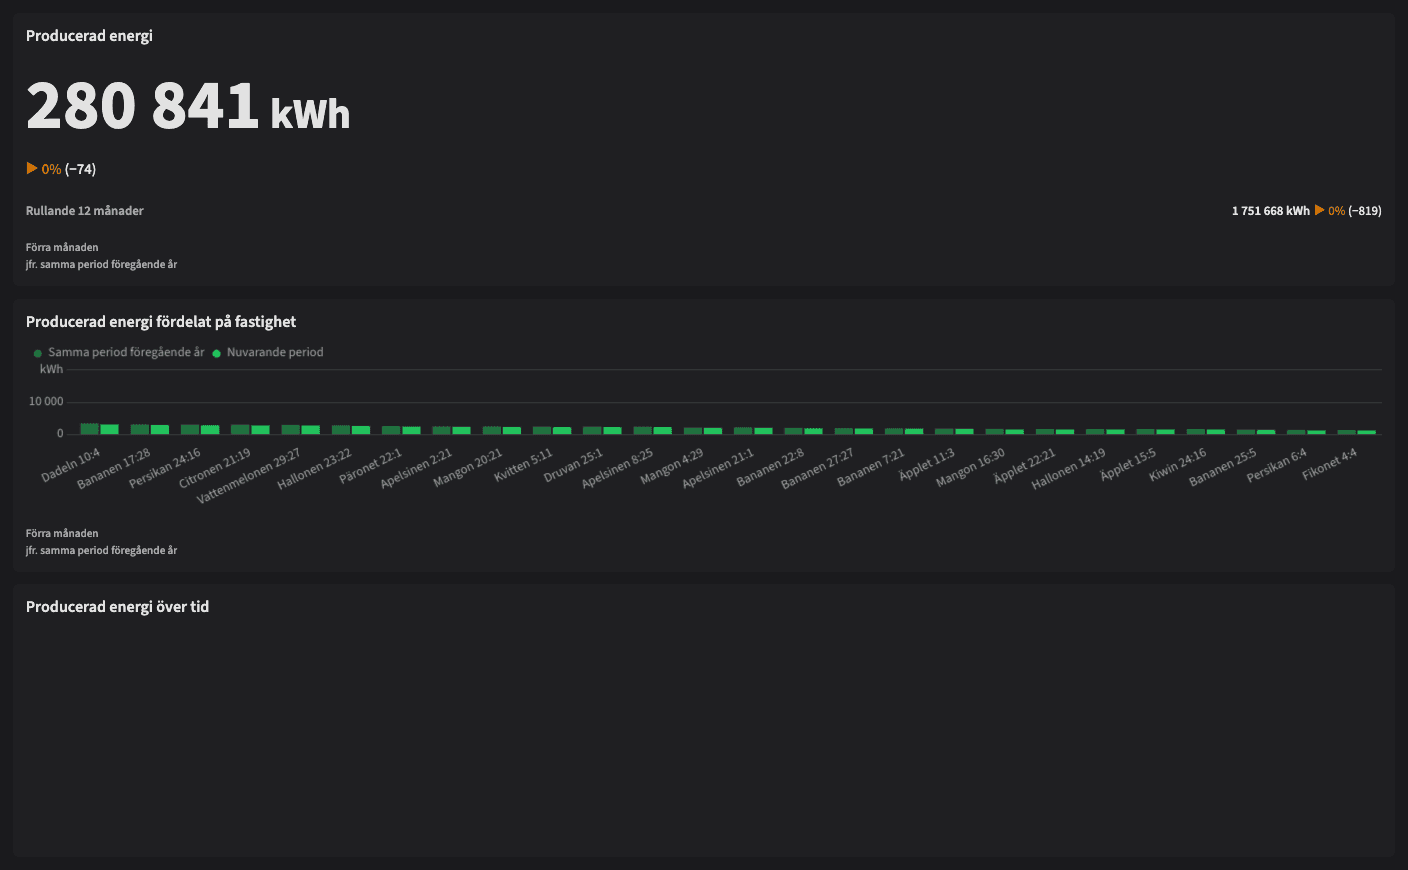
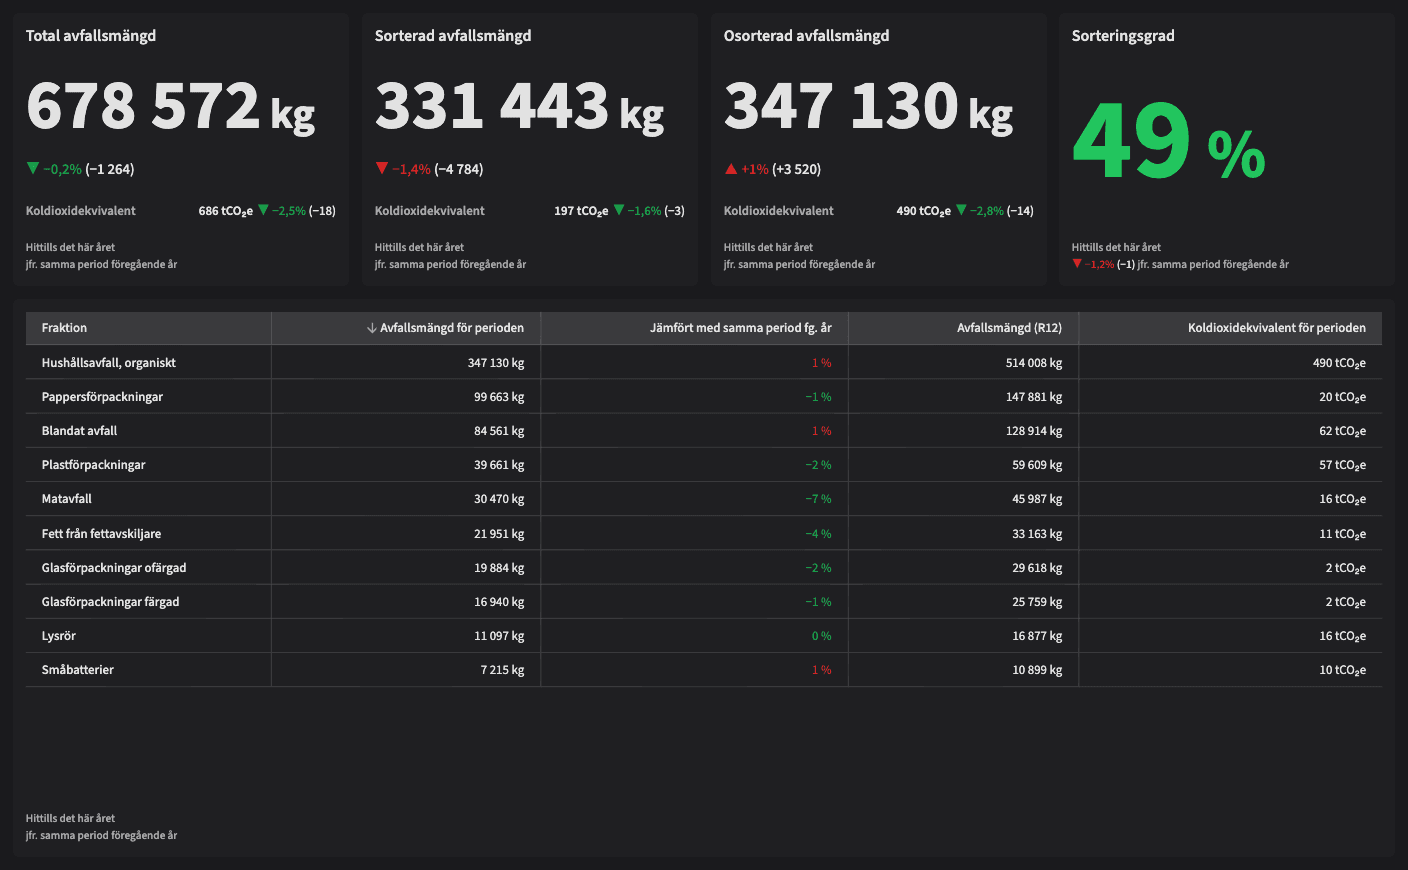


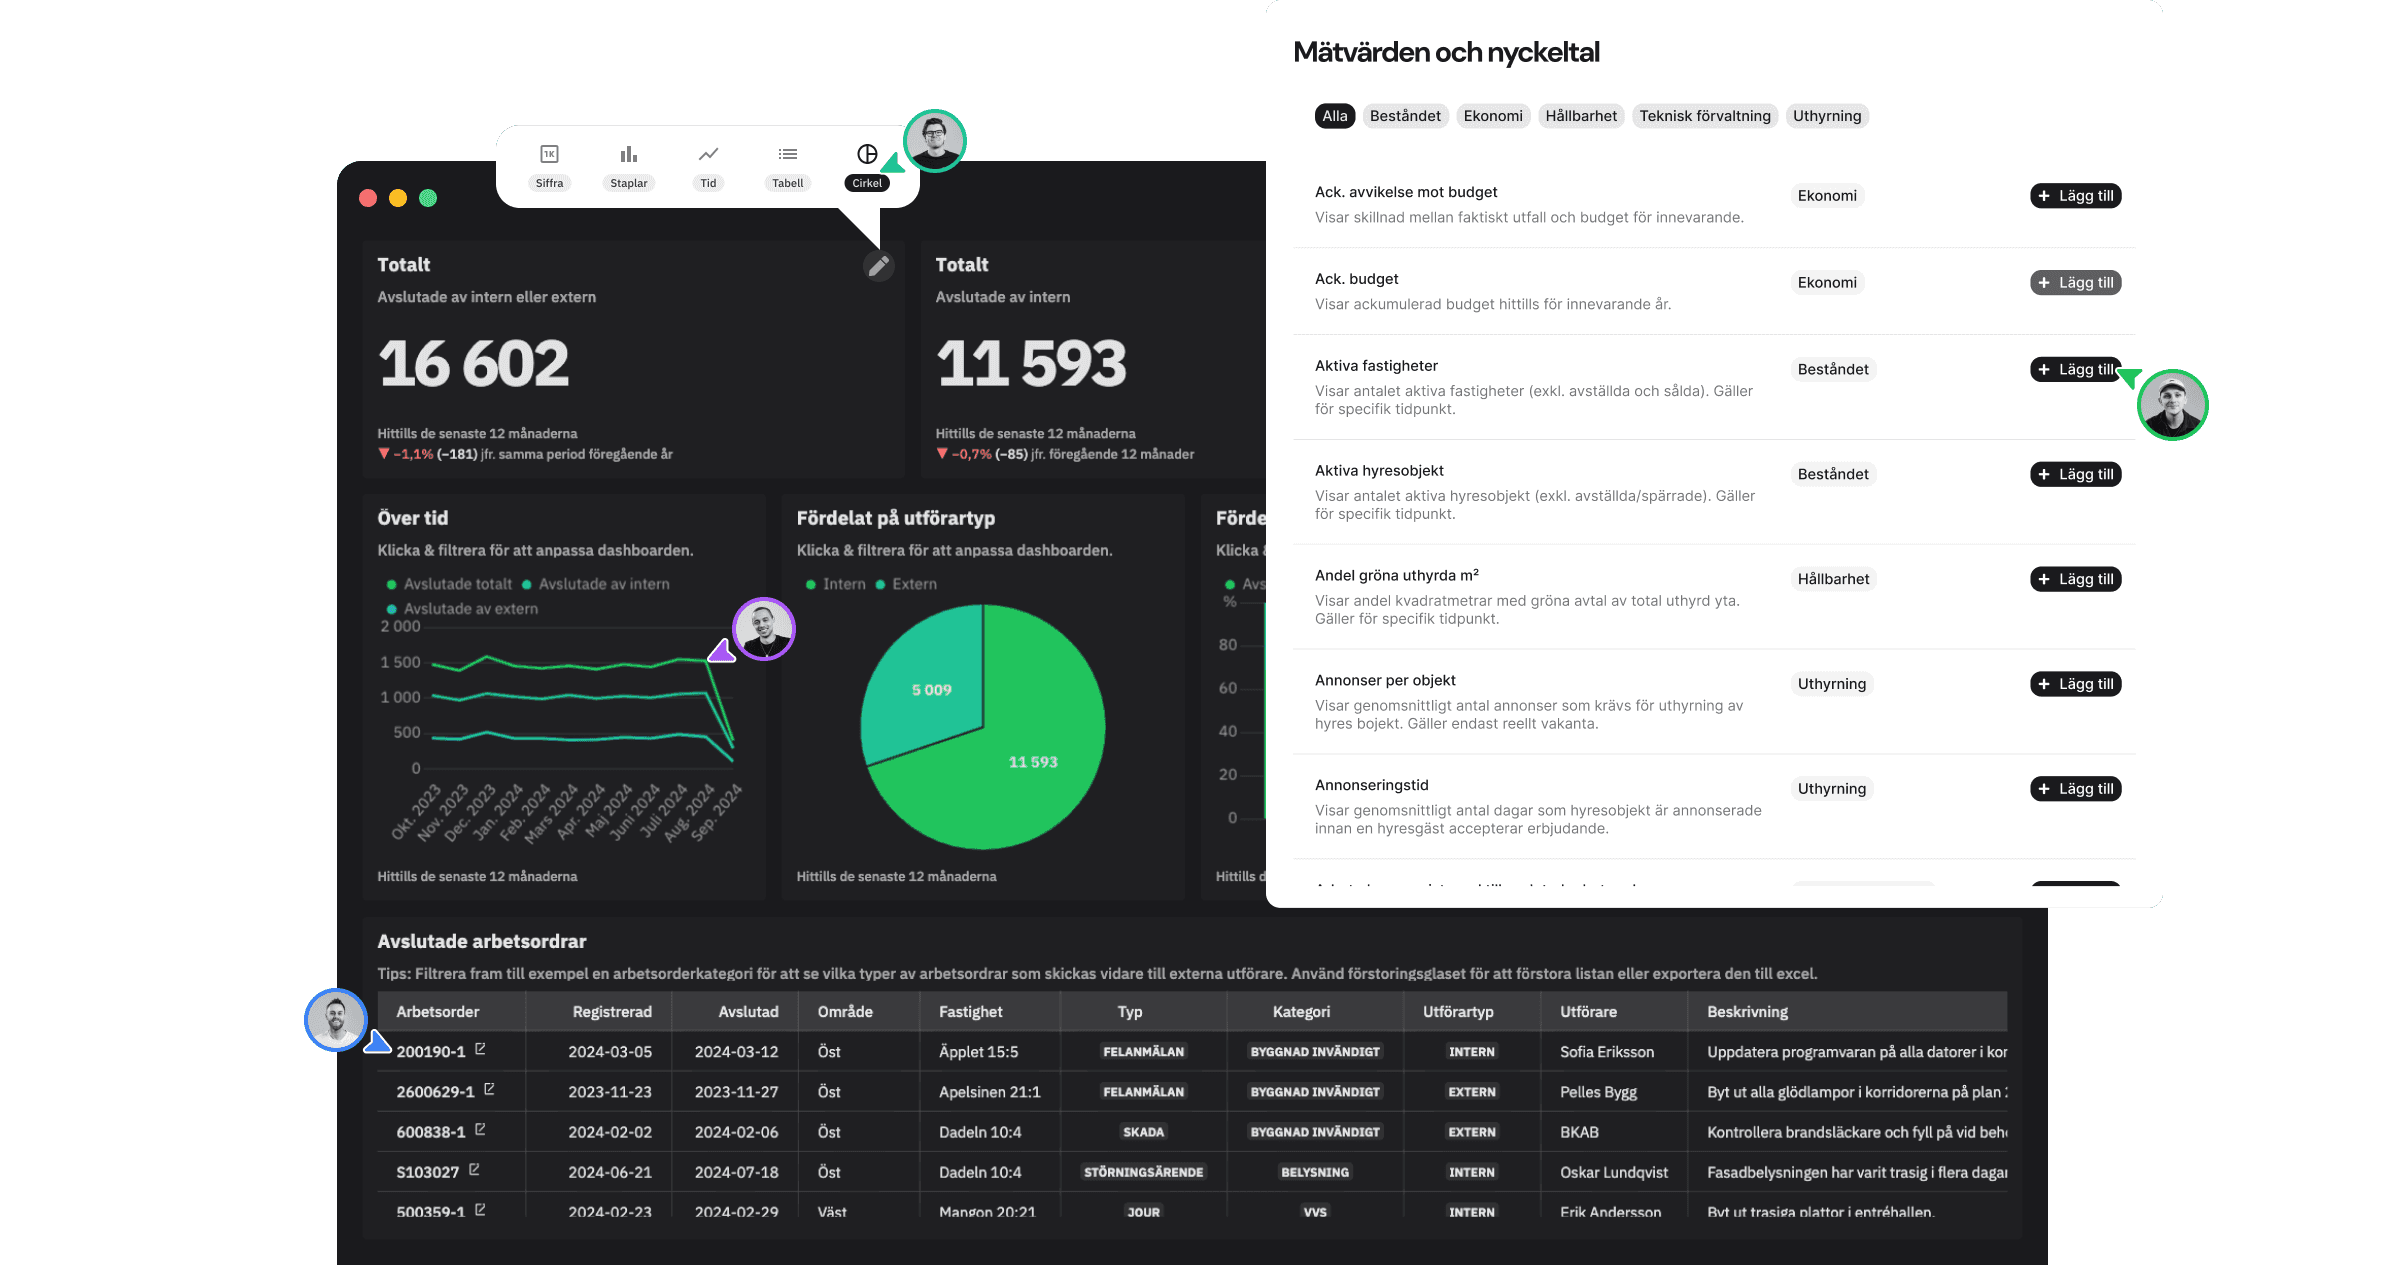
Metrics and KPIs
We have standardized and automated the industry's most common KPIs. Activate with one click in our catalog and start analyzing.
Change however you want, whenever you want
In Homepal, it's easy to change or edit just the way you want. You don't need to be a data engineer or visualization professional.
Expensive consultant invoices and long waiting times are a thing of the past. 👋


A BI tool purpose-built for the needs of the real estate industry
Automate your follow-up and reporting with ready-made key figures and dashboards. Spend your time analyzing and acting instead of cutting and pasting in Excel or waiting a consultant case.

Join your industry colleagues


Take a step into the next generation
No gigantic IT project, no system change, no consultants. Activate an add-on solution that has already been refined for many years and with thousands of players in the real estate industry.


30 dashboards för fastighetsbolag
Homepals andra e-bok fylld med exempel på dashboards för att optimera ekonomi, hållbarhet, teknisk förvaltning och uthyrning inom fastighetsbranschen.
