
Overview
A results-driven analytics tool, built for the real estate industry
Data everyone understands. Insights that actually get used. Standardised metrics and trees for real estate — so you can spot deviations, find the cause, and focus where it matters most.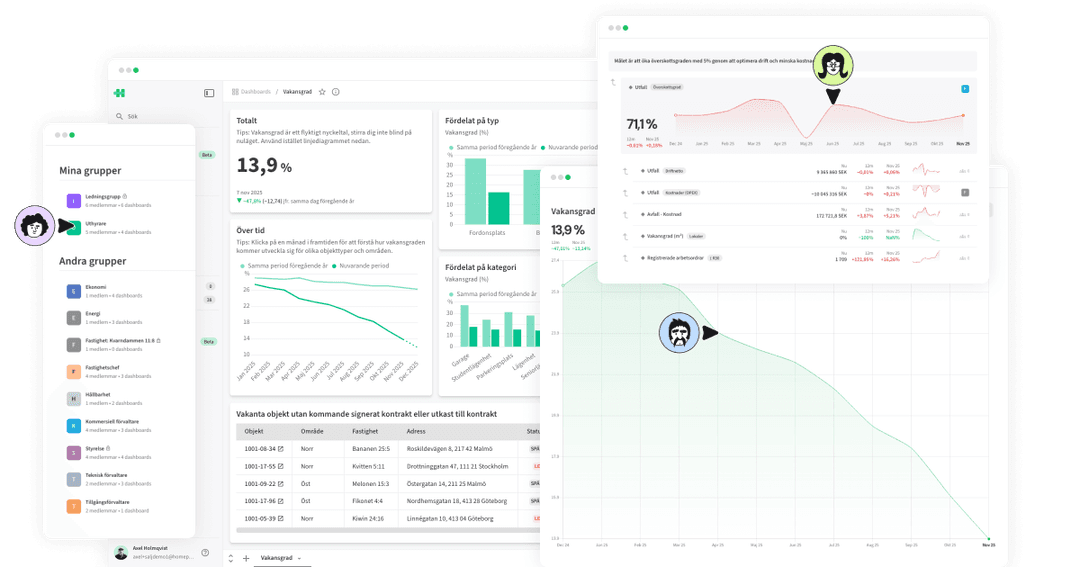
Developed together with 45+ real estate companies
Developed together with 45+ real estate companies
Metrics
Standardised metrics from the industry. Centralised, automated and always up-to-date – directly in the tool.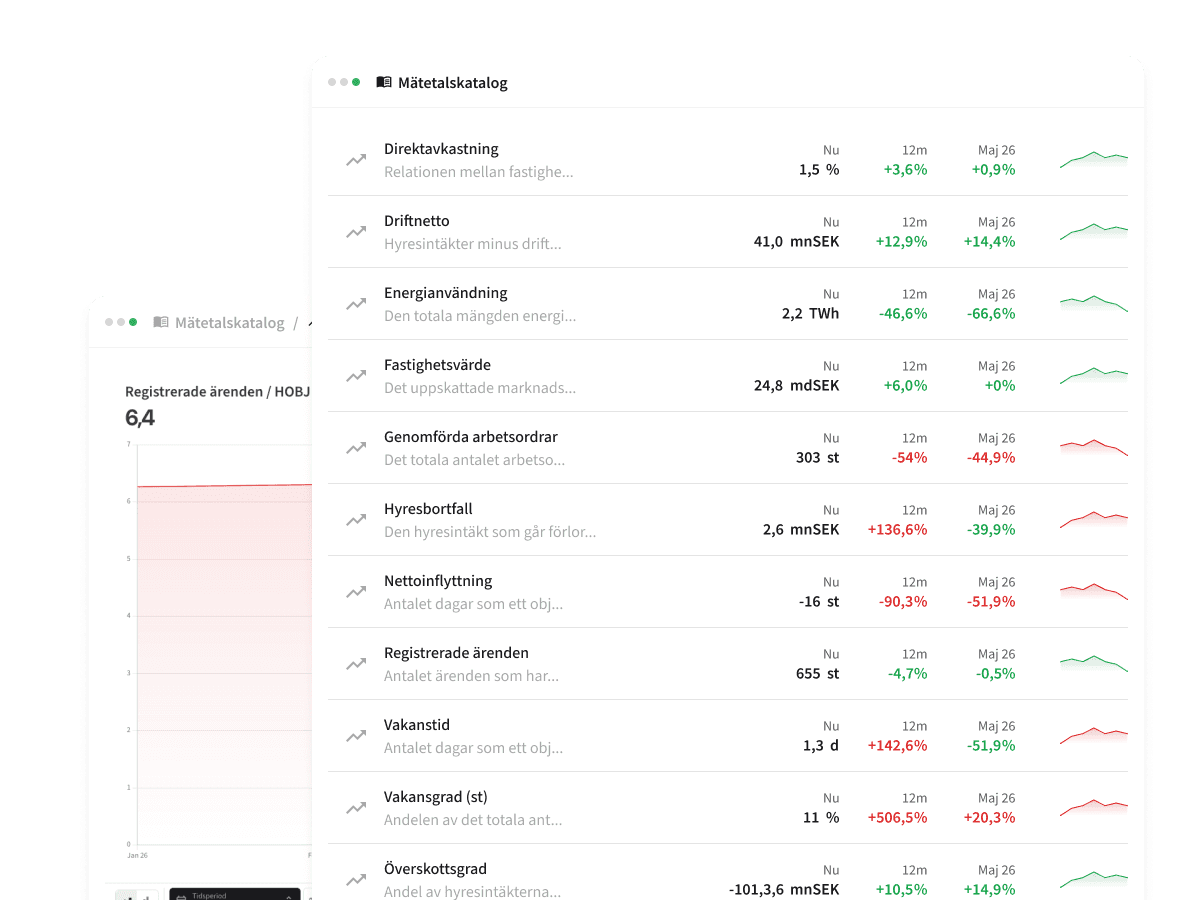
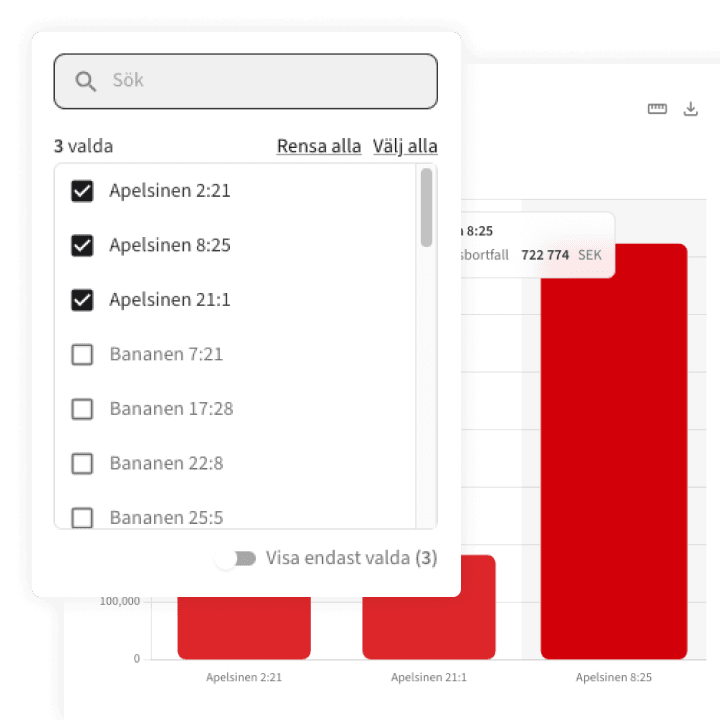
Fast and easy focus
You always decide what is visible – filter and segment according to your specific case.
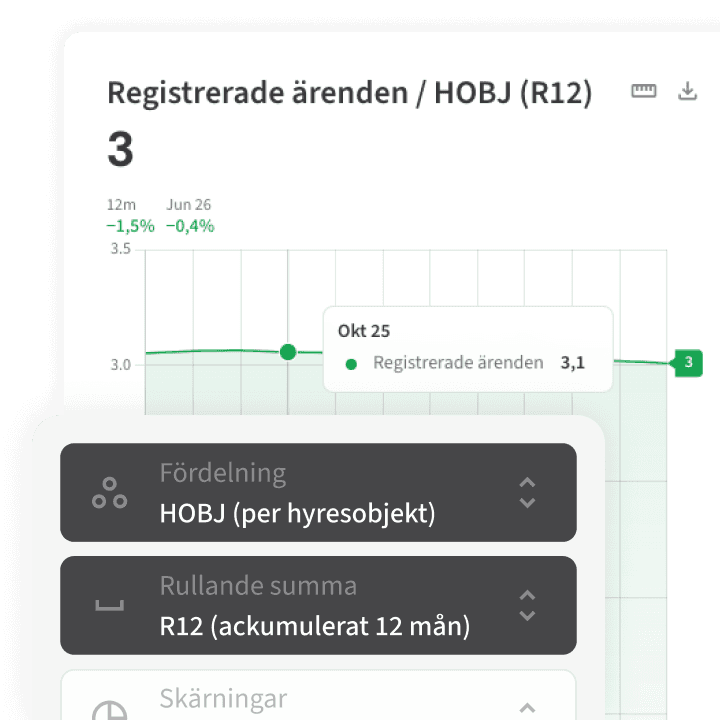
Fair variants
Distribute metrics by comparable unit, or roll it over any period, to get a fairer analysis.
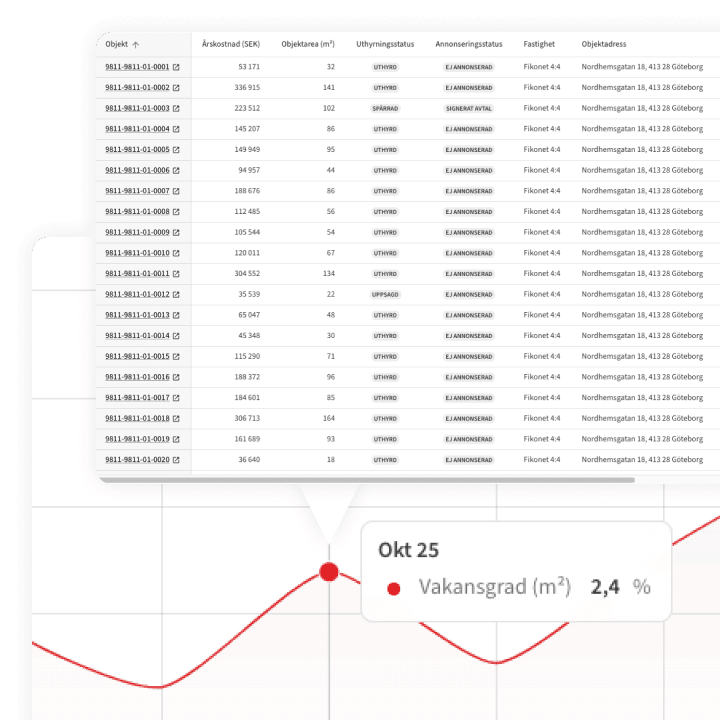
Detailed traceability
Break down a metric level by level until you see which individual lines lie behind the number.
Fast and easy focus
You always decide what is visible – filter and segment according to your specific case.
Fair variants
Distribute metrics by comparable unit, or roll it over any period, to get a fairer analysis.
Detailed traceability
Break down a metric level by level until you see which individual lines lie behind the number.
Metrics catalog
270+ standardised industry metrics
All relevant metrics for the industry – defined, up-to-date and consistent across the entire platform.Dashboards
Your go-to tool for day-to-day work. Identify issues, determine their causes, and create a plan for improvement.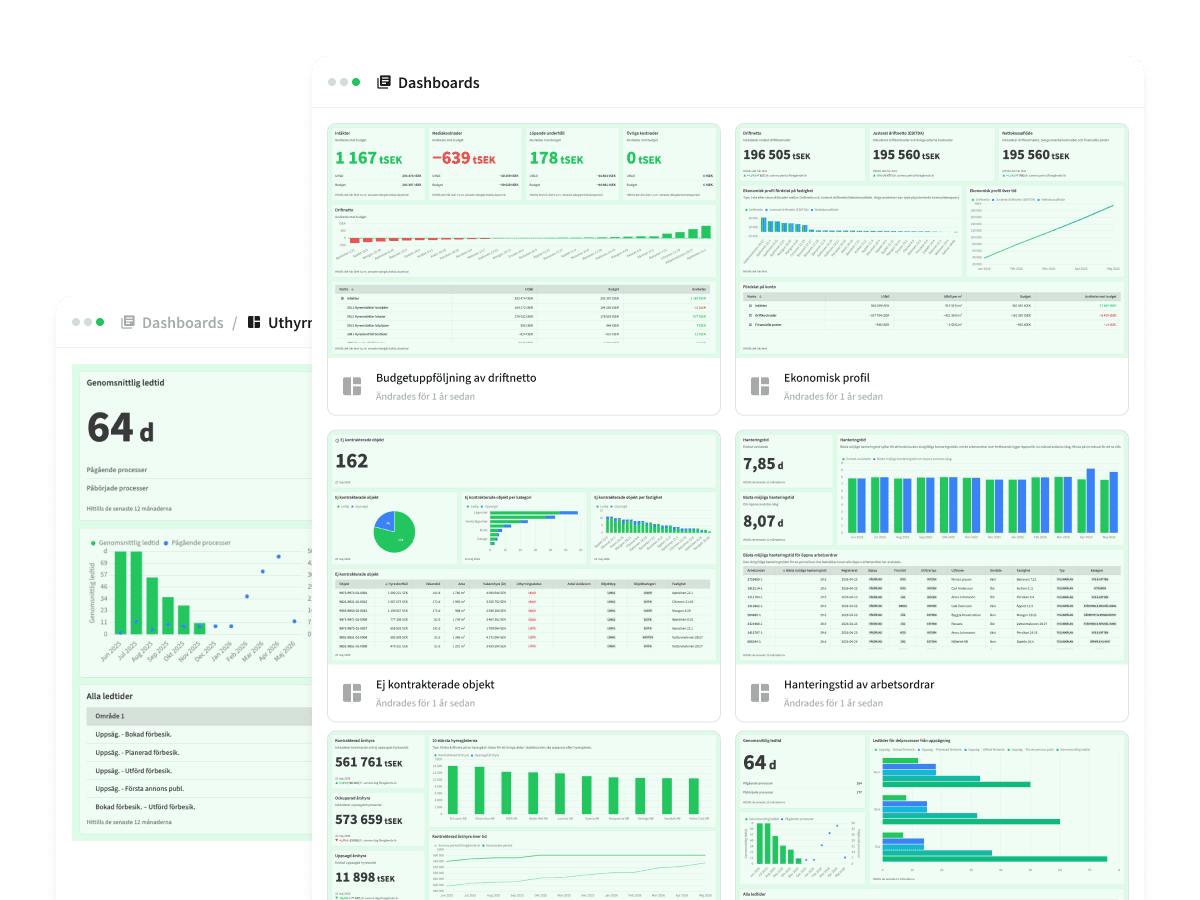
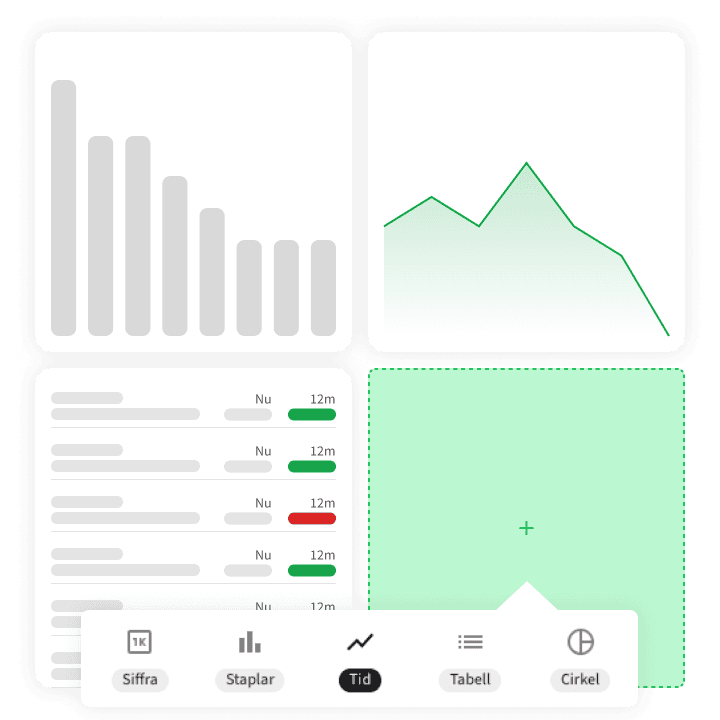
Visualise freely
Build your perfect view with simple and ready-made building blocks – without a line of code or IT help.
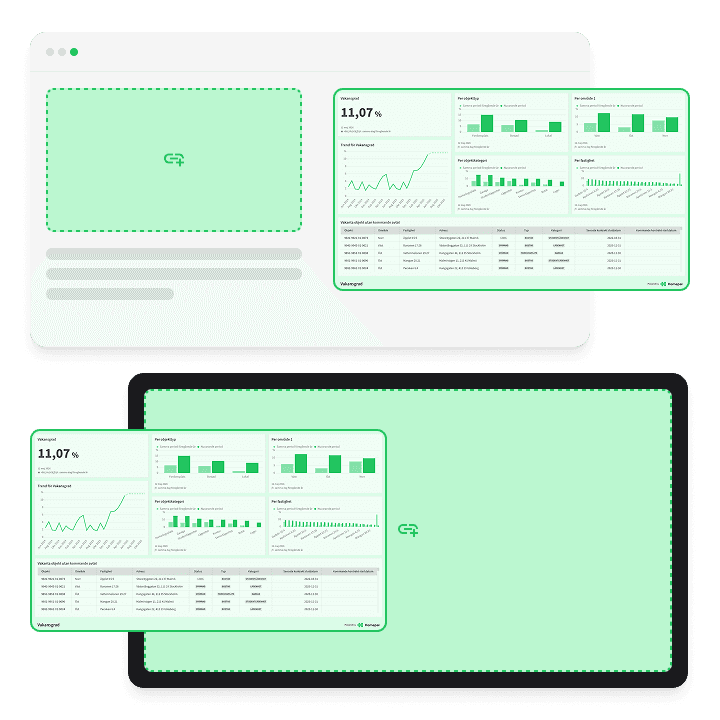
Share publicly
Send a link to colleagues, embed on the intranet or let it scroll on your TV screens.
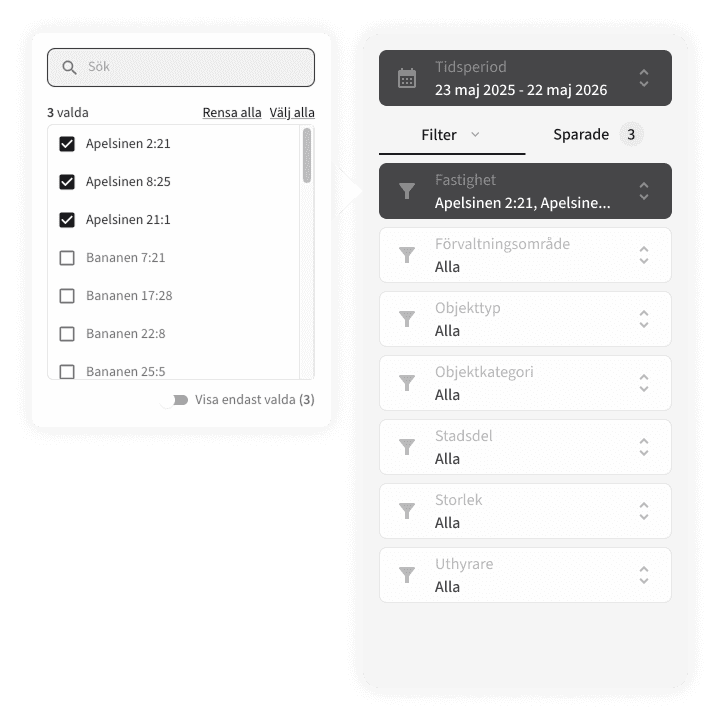
Global filters
Filter the entire dashboard in one place. Your choice will be reflected in all parts at the same time.
Visualise freely
Build your perfect view with simple and ready-made building blocks – without a line of code or IT help.
Share publicly
Send a link to colleagues, embed on the intranet or let it scroll on your TV screens.
Global filters
Filter the entire dashboard in one place. Your choice will be reflected in all parts at the same time.
Dashboard templates
Dashboards from your industry peers
Created with the industry, for the industry – ready to be activated directly. Each dashboard focuses on improving a specific key metric.Insights
Deviations in your key metrics for specific properties that show what you can gain through efforts.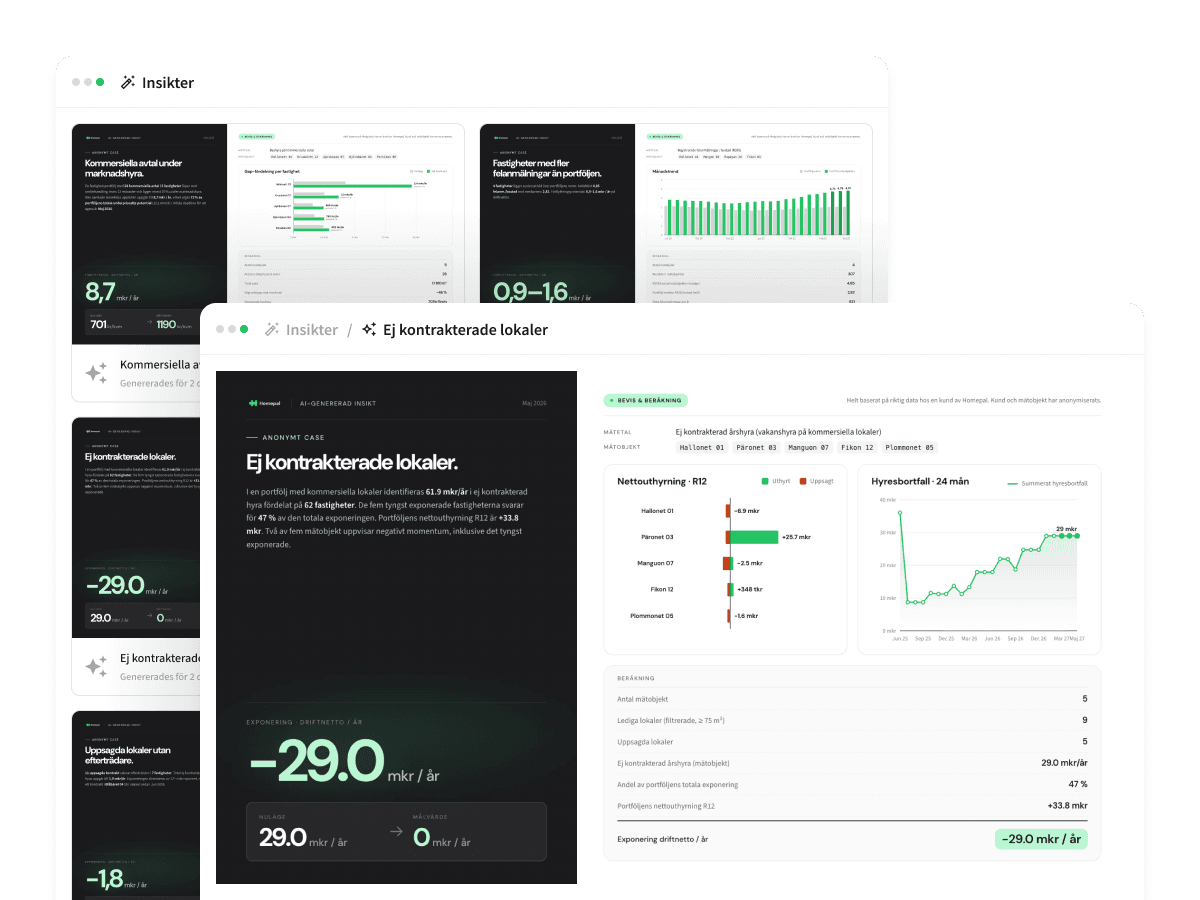
Key metric tree
See how operating net connects to your leading and operational key metrics – in a tree with always up-to-date data.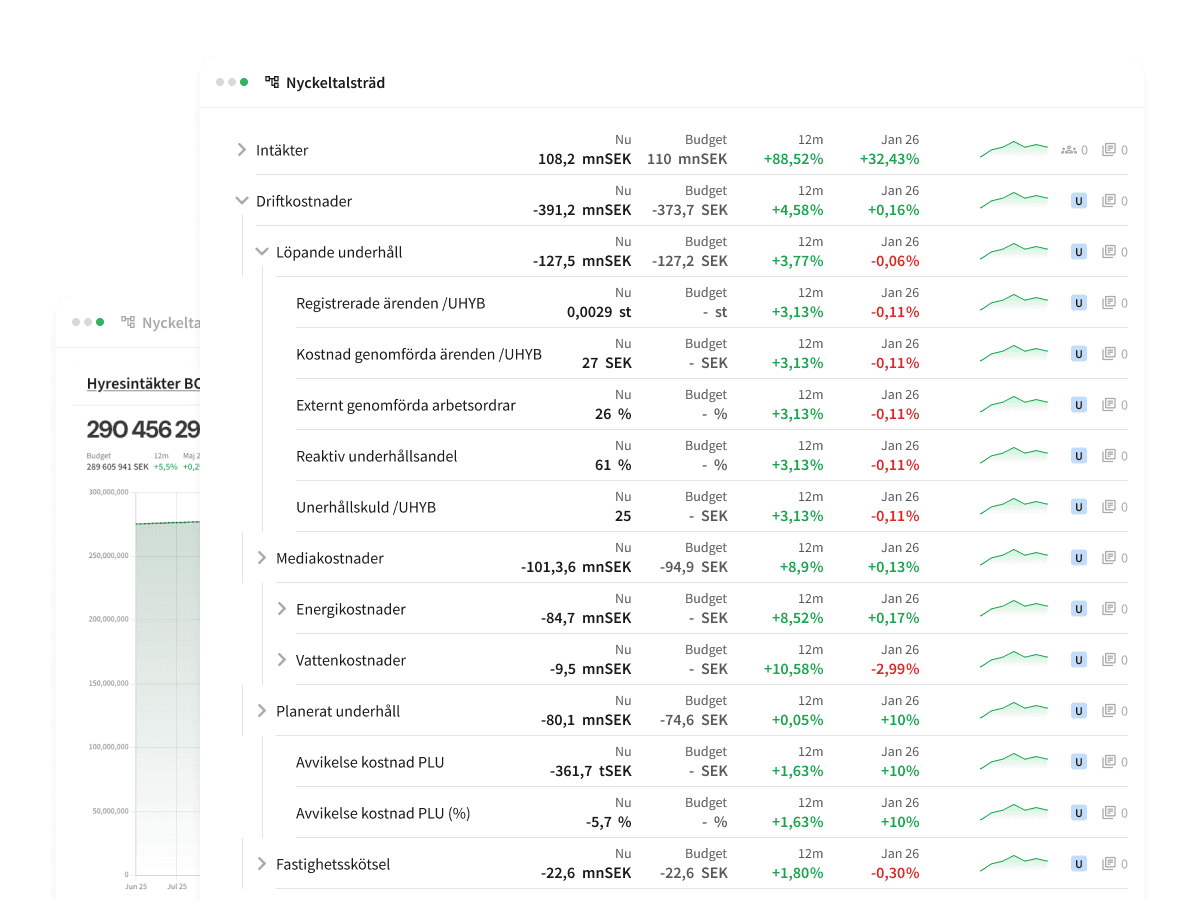
AI-ready platform