Future-proof analysis
Increase the operating net with faster and better decisionsIncrease the operating net with faster and better decisions
Now you can see exactly what needs to be done, track every action, and watch your operating profit improve—in real time.portal.homepal.se
Dashboards
Team metrics
AI analyses
Underlying data
Organisation tasks
JJosefin
JJanne
MMikaela
Developed together with 45+ real estate companies
"Everything went super fast! It's about weeks in order to be up-and-running with Homepal, not months or years like with many other systems."
C
Christoffer Greijer
IT- och digitaliseringsansvarig
"As a manager, I have to give my employees the conditions and tools to succeed, even when the market changes. That's why I bought Homepal."
A
Anette Jansson
Kund- och uthyrningschef
"I use Homepal to track trends in rent loss, vacancy area, and to quickly see if we're headed in the right direction. I almost always have it up."
N
Niclas Nilsson
Fastighetschef
Results-driven data
Ongoing work for a higher operating net profitOngoing work for a higher operating net profit
Full overview of which areas for improvement exist – and which ones yield the most. Translated into practical work with metrics, transfer and follow-up.

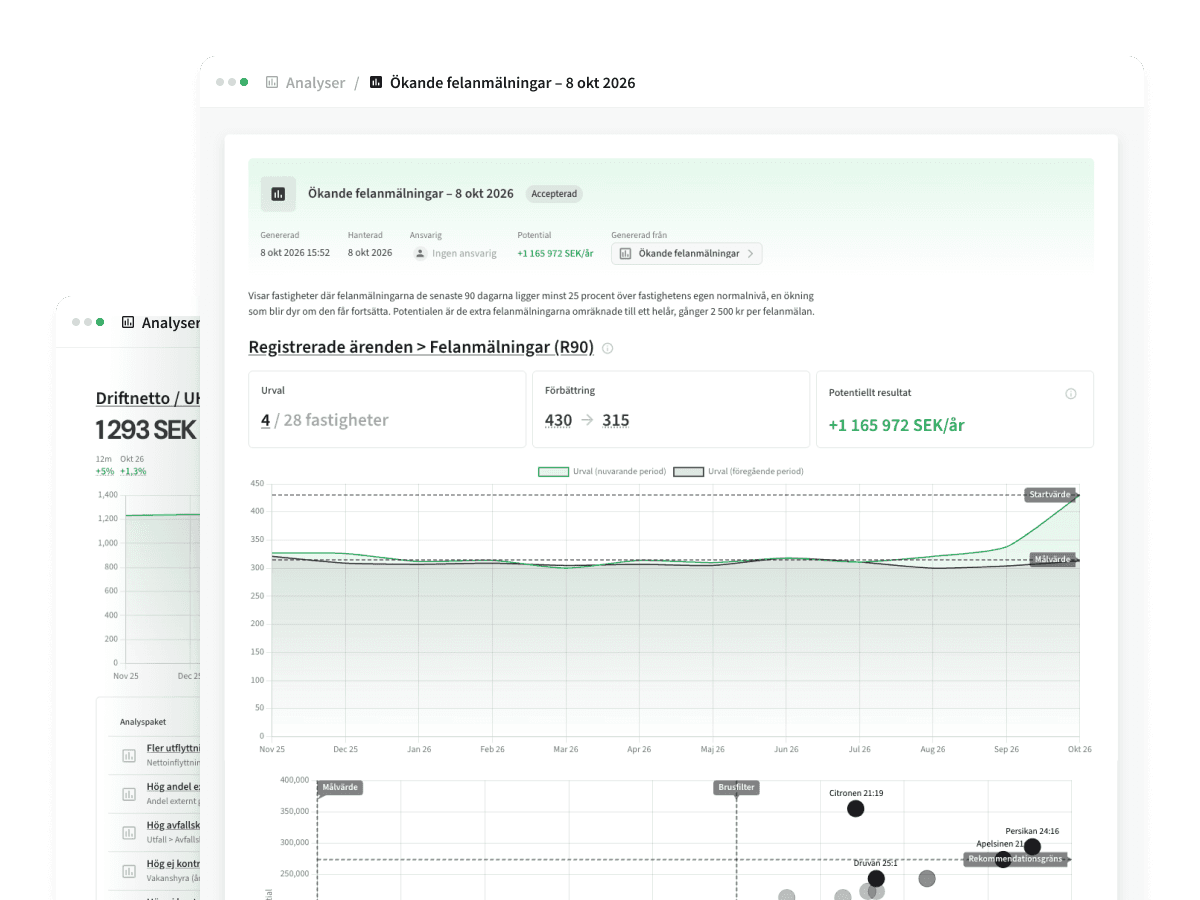
Analyses
On demand, our AI scans your key metrics and pinpoints where an investment will make the biggest difference — and estimates what you stand to gain.
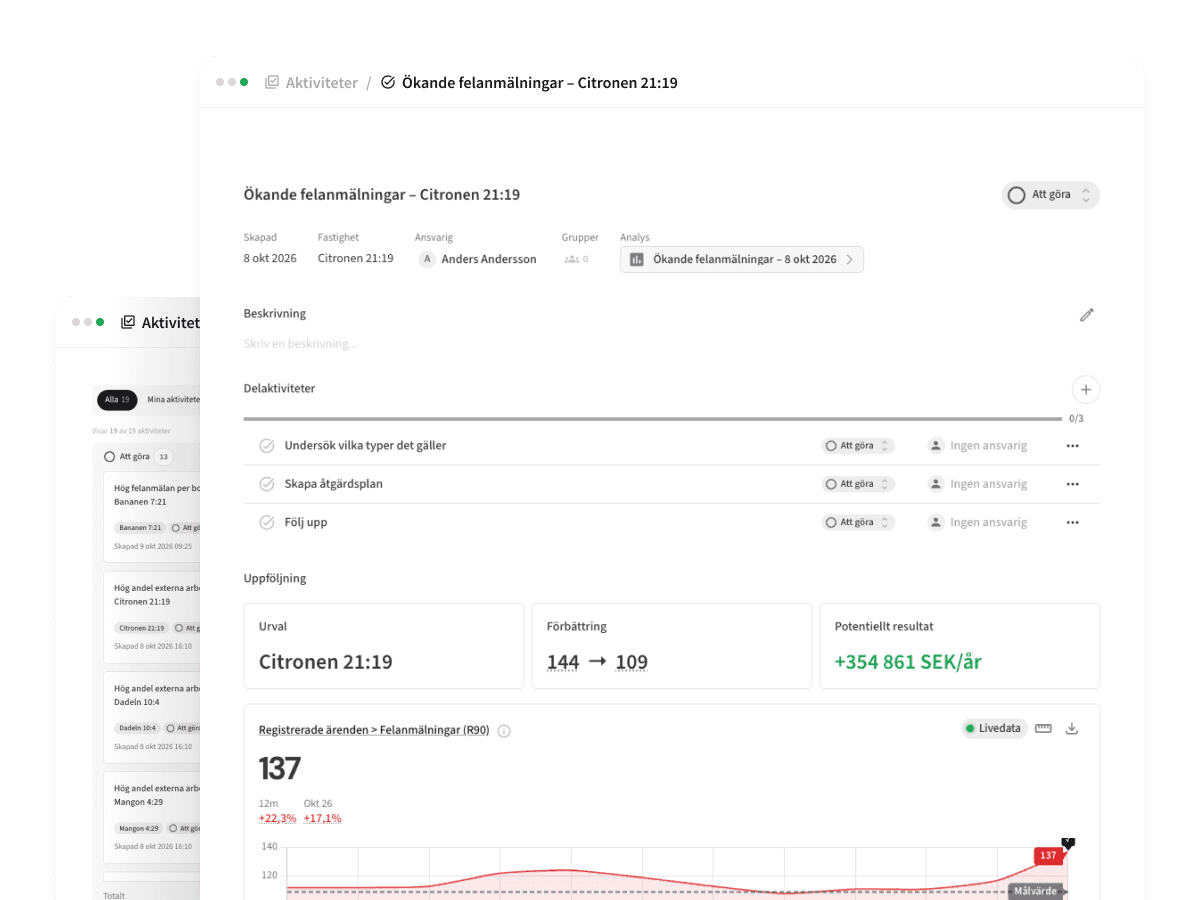
Analyses
On demand, our AI scans your key metrics and pinpoints where an investment will make the biggest difference — and estimates what you stand to gain.
Available data
Up-to-date data available to everyoneUp-to-date data available to everyone
Stop chasing data. Get numbers and information that are hard to reach in other systems in a structured, up-to-date and accessible way – for the entire organisation.
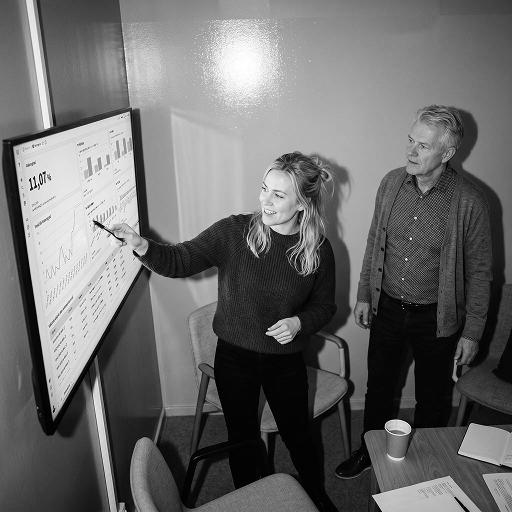
Dashboards
Create dashboards for your team, your role, and your area of responsibility using data that’s always up to date. Get clear answers on what needs to be done next.
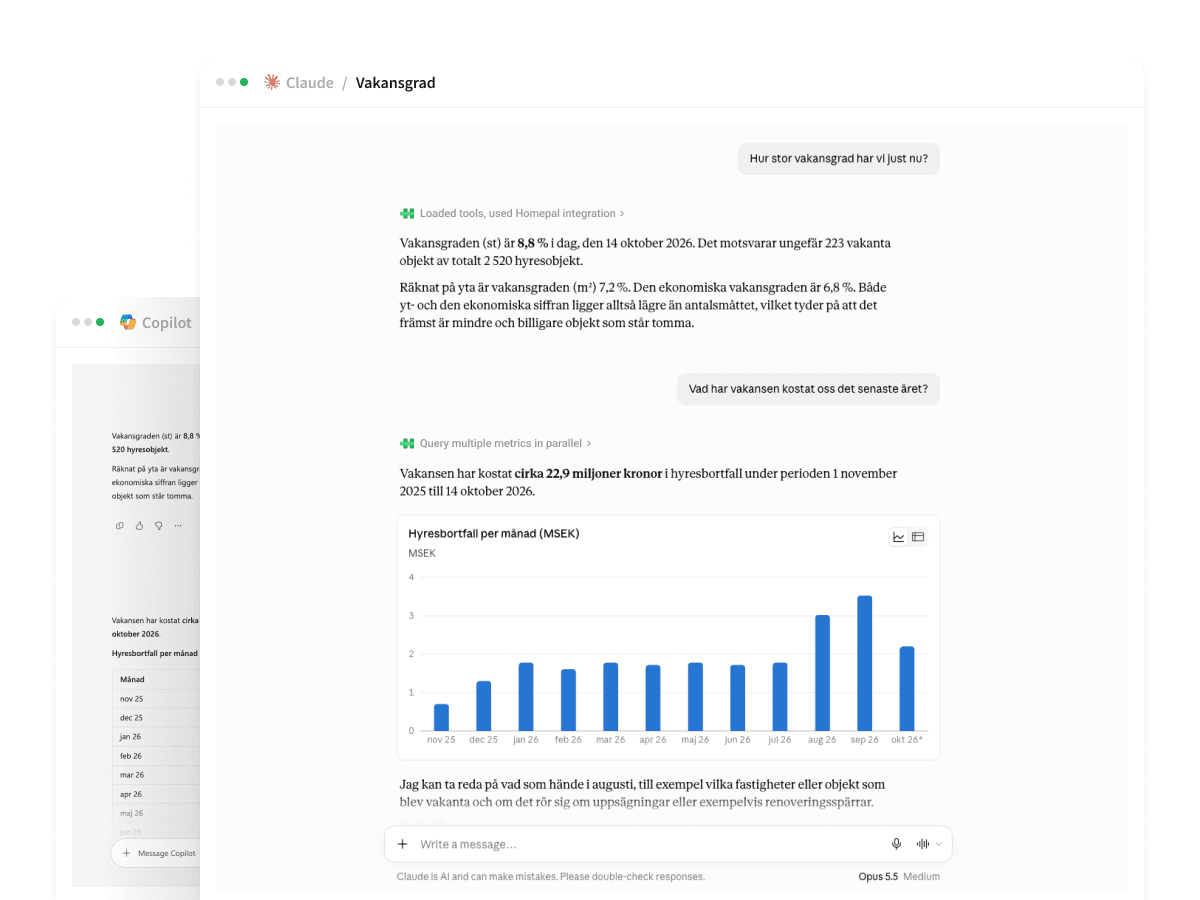
MCP
Ask about your metrics and portfolio directly in the AI chat you use. Every answer is built on the exact same numbers you see in Homepal.

Dashboards
Create dashboards for your team, your role, and your area of responsibility using data that’s always up to date. Get clear answers on what needs to be done next.

MCP
Ask about your metrics and portfolio directly in the AI chat you use. Every answer is built on the exact same numbers you see in Homepal.
Metrics catalog
300+ standardised industry metrics300+ standardised industry metrics
All relevant metrics for the industry – defined, up-to-date and consistent across the entire platform.Accepted Rental Offers
96▲Active Listings
29▲Administrative Costs tSEK
1 500▼Applications
46▼Applications per Listing
43▼Average Interest Rate %
3,34▼Average Tenant Age år
42▲Balance tSEK
1 200▲Budget tSEK
1 200▲Carbon Emissions tCO₂e
174,9▼Cleaning tSEK
1 200▼Common Area m²
1 400▼Completed Cases
40▼Completed Projects
96▲Completed Work Orders
122▲Contracted Occupancy Rate %
94▲Contracted Rent (Monthly) SEK
7 000▼Contracted Rent (Annual) SEK
1 230 000▼Contracted Rent per m² SEK/m²
1 230▼Direct Yield %
4▼Energy Budget Utilization %
87▲Energy Consumption MWh
174▲Energy Costs tSEK
300▲Energy Production kWh
523▼Expressions of Interest
83 290▼Gross Floor Area m²
96 000▼Heated Floor Area m²
103 000▼Initiated Projects
96▲Invoiced Rent Amount SEK
12 000▲Listing Duration d
29▲Completed Projects
96▲Completed Work Orders
122▼Contracted Occupancy Rate %
94▼Contracted Rent (Monthly) SEK
7 000▼Contracted Rent (Annual) SEK
1 230 000▼Contracted Rent per m² SEK/m²
1 230▲Direct Yield %
4▲Energy Budget Utilization %
87▲Energy Consumption MWh
174▼Energy Costs tSEK
300▼Energy Production kWh
523▼Expressions of Interest
83 290▼Gross Floor Area m²
96 000▲Heated Floor Area m²
103 000▲Initiated Projects
96▲Invoiced Rent Amount SEK
12 000▼Listing Duration d
29▼Listings per Leasing Process
2,4▼Move-In Rate %
34▼Move-Ins
34▲Move-Out Rate %
34▲Move-Outs
23▲Moving-in Tenants
45▼Moving-out Tenants
38▼Net Cash Flow tSEK
313▼Net Debt tSEK
12 000▼Net Leasing (m²) m²
4 232▲Net Move-Ins
6▲Number of Buildings
40▲Number of Companies
96▼Heated Floor Area m²
103 000▼Initiated Projects
96▼Invoiced Rent Amount SEK
12 000▼Listing Duration d
29▼Listings per Leasing Process
2,4▲Move-In Rate %
34▲Move-Ins
34▲Move-Out Rate %
34▼Move-Outs
23▼Moving-in Tenants
45▼Moving-out Tenants
38▼Net Cash Flow tSEK
313▲Net Debt tSEK
12 000▲Net Leasing (m²) m²
4 232▲Net Move-Ins
6▼Number of Buildings
40▼Number of Companies
96▼Number of Lease Agreements
3 201▼Number of Loans
10▲Number of Properties
96▲Number of Rental Units
2 842▲Number of Rooms
40▼Number of Tenants
7 839▼Ongoing Maintenance tSEK
313▼Ongoing Projects
96▼Open Cases
48▲Open Work Orders
48▲Operating Costs tSEK
1 200▲Operating Net tSEK
12 000▼Planned Maintenance tSEK
1 500▼How it works?
From spotting a deviation to proving the impact From spotting a deviation to proving the impact
Our product provides comprehensive support for identifying deviations, understanding their impact on the bottom line, and improving the areas that yield the greatest effect on results.Step 1
Identify
What’s happening, and where? The entire portfolio is continuously monitored, so that any deviations are spotted early.
Step 2
Analyze
Why is it happening? Take a deep dive and analyze further until you understand what lies behind the figure.
Step 3
Take action
What do we do about it, and who owns it? An action plan with assigned responsibilities, a timeline, and a clear goal.
Step 4
Follow up
Did it have the effect we wanted? The impact is measured over time, so that you can see what the improvement actually yielded.
Step 1
Identify
What’s happening, and where? The entire portfolio is continuously monitored, so that any deviations are spotted early.
Step 2
Analyze
Why is it happening? Take a deep dive and analyze further until you understand what lies behind the figure.
Step 3
Take action
What do we do about it, and who owns it? An action plan with assigned responsibilities, a timeline, and a clear goal.
Step 4
Follow up
Did it have the effect we wanted? The impact is measured over time, so that you can see what the improvement actually yielded.
Connections
Connect your data in no timeConnect your data in no time
We are experts in real estate data and have built standard connections to most systems used in the industry.FAQ
Questions? We got answers.Questions? We got answers.
Hopefully we can answer your final questions here.Can't find what you're looking for? Contact our team at hej@homepal.se
AI-ready platform


