OPEX Tracking – identify cost drivers & improvement potential
This dashboard is intended for operations/property leaders and finance/procurement teams who need visibility into OPEX per m², total cost, and where costs originate – by vendor, region/property, and cost category (e.g., cleaning, waste, utilities/media, site services).
Who is watching it? | Monthly (close & review) and quarterly (procurement/budget). For exceptions – ad hoc. |
|---|---|
How often? | Monthly |
Why you should use the dashboard?
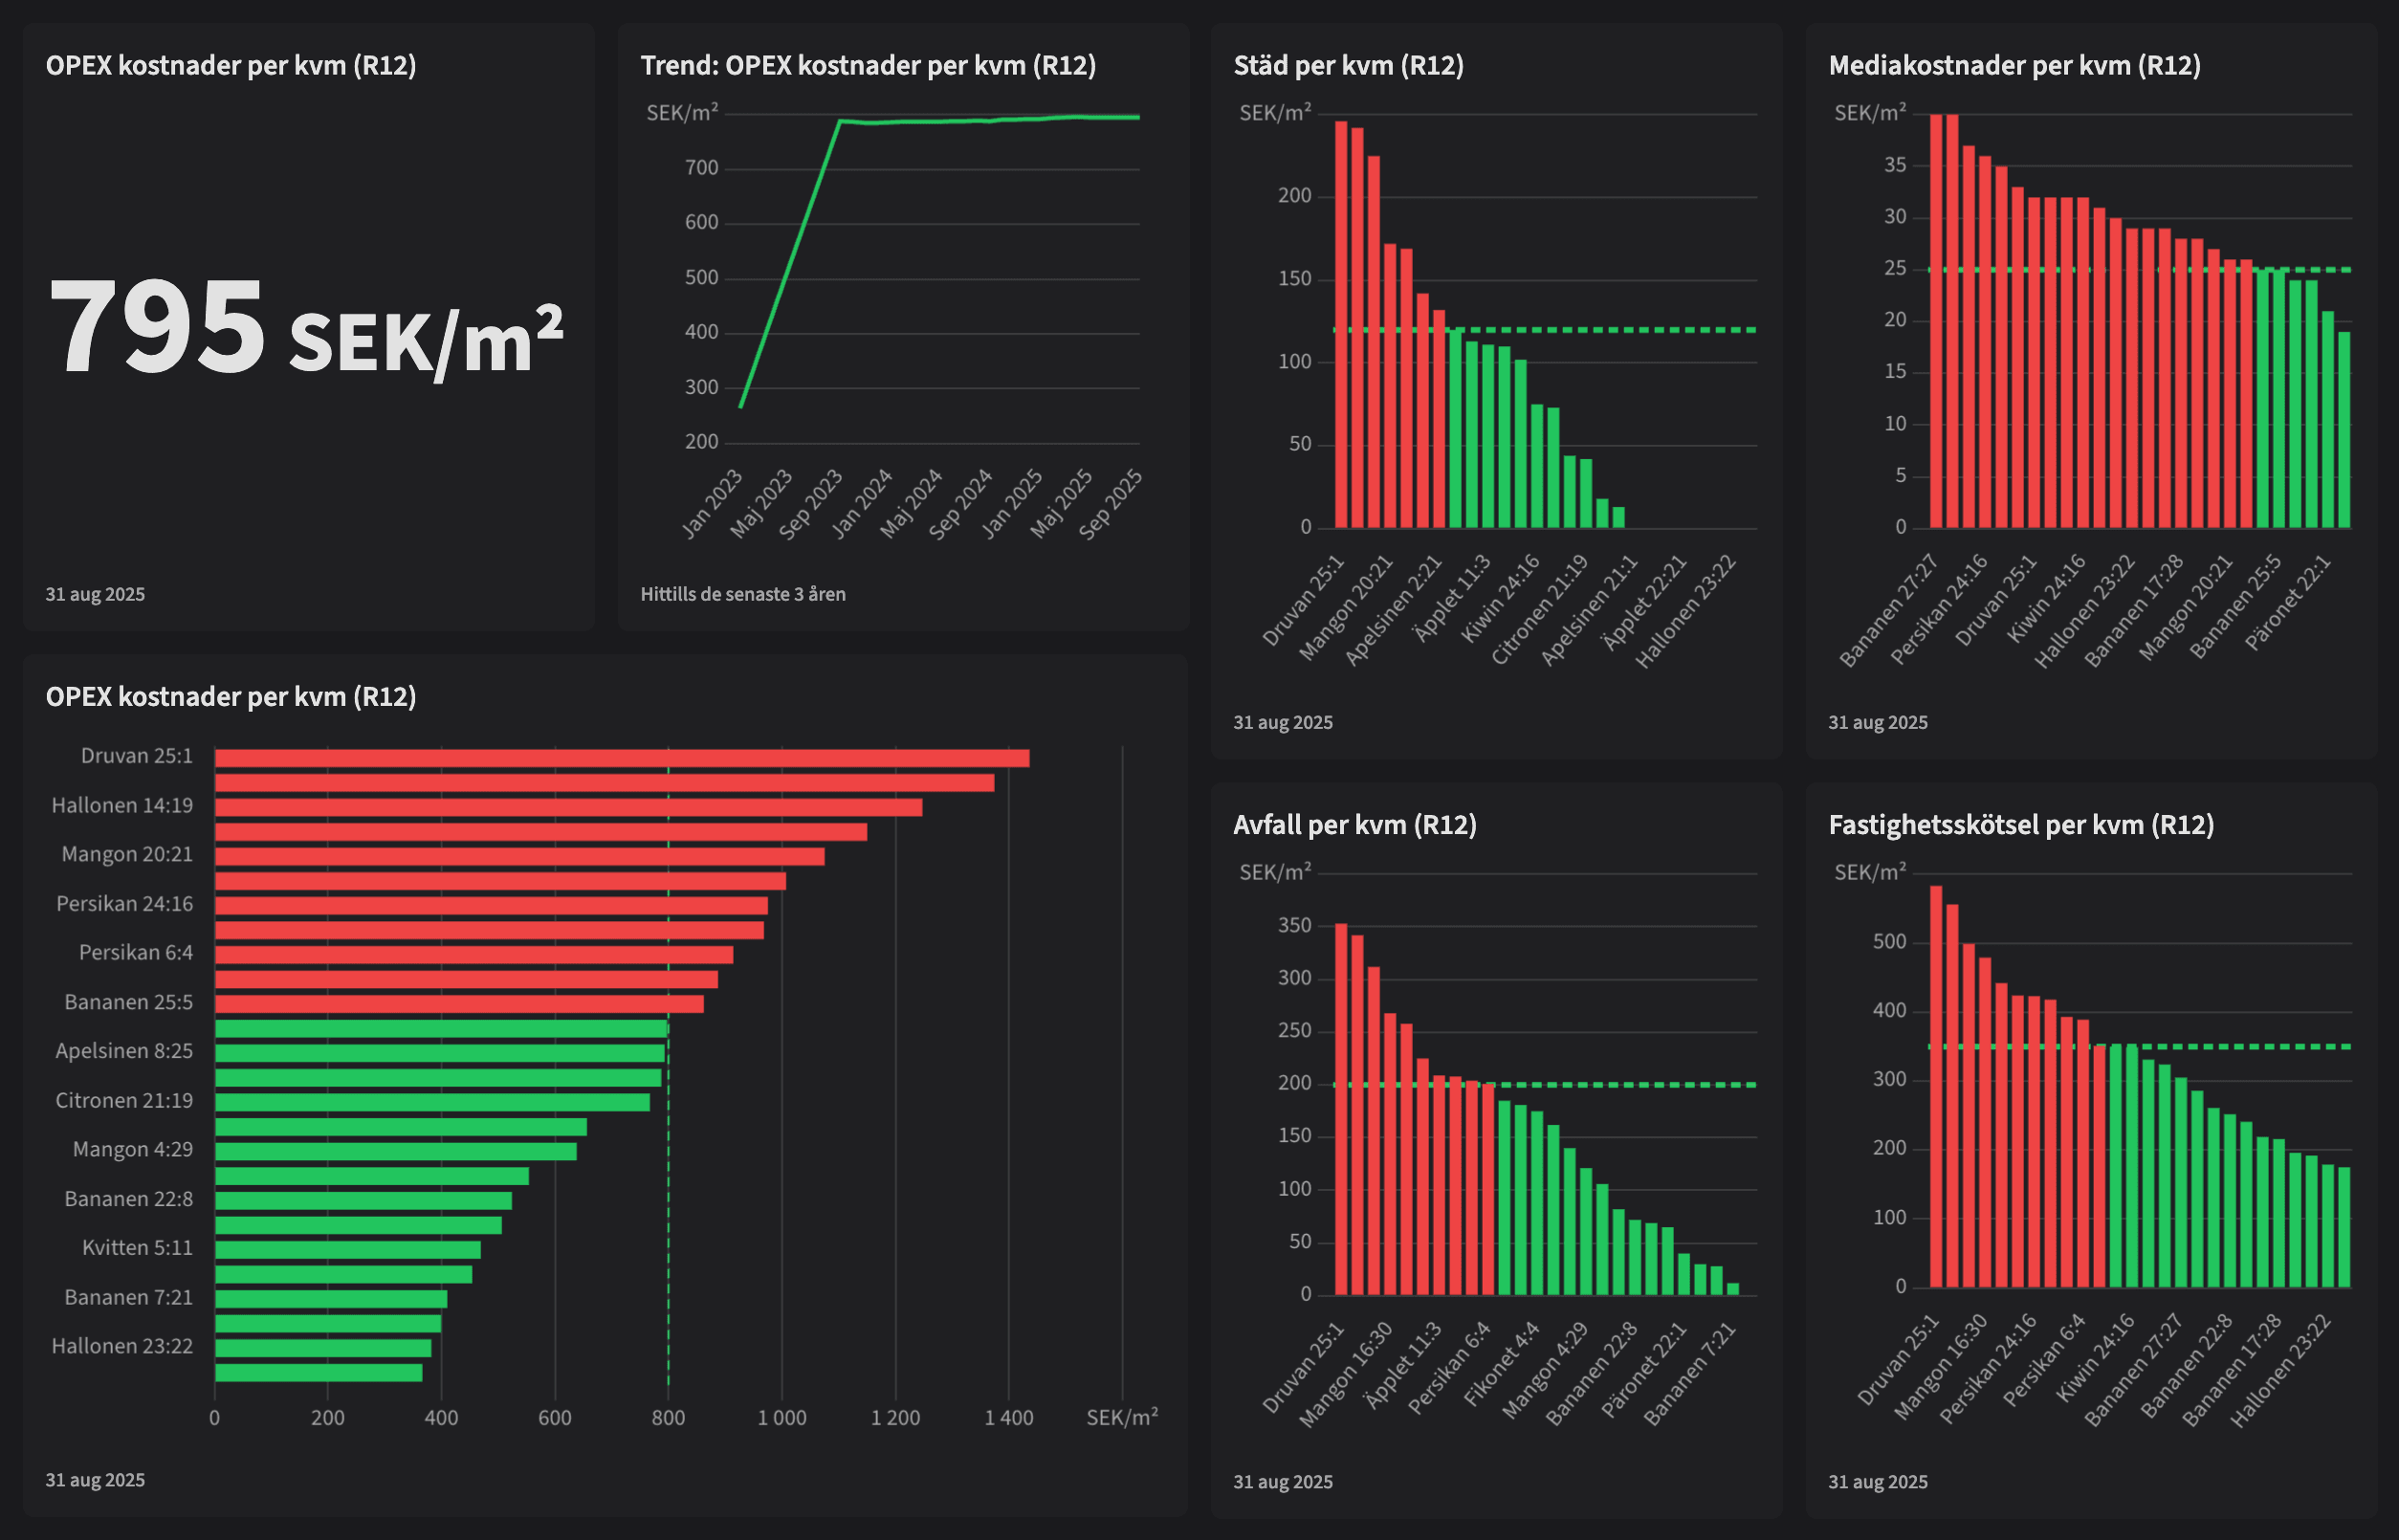
It presents OPEX/m² (R12) and total OPEX, time trends, year/period comparisons, and a cost split by vendor. The bottom table benchmarks regions/properties with per-m² KPIs for key categories. The goal is to quickly surface outliers, leakages, and negotiation opportunities, then prioritize actions that measurably reduce OPEX/m².
Hints!
Tips on what to focus on:
Spot properties with high OPEX per sqm compared to the average – what cost drivers stand out?
Break down cleaning, waste, utility costs – are any unusually high?
Look at trends over time – are some properties becoming more expensive to run?
Use the view in operations meetings and budget planning to support fact-based decisions.
Combine with pass-through rate to see what costs remain with the property owner.
System examples

Vitec Ekonomi
Vitec Verksamhetsanalys


Join your industry colleagues


Future-proof data-drivenproperty analysis
No gigantic IT project, no system change, no consultants. Activate an add-on solution that has already been refined for many years and with thousands of players in the real estate industry.


