Results-driven data
Ongoing work for a higher operating net profit
Full overview of which areas for improvement exist – and which ones yield the most. Translated into practical work with metrics, transfer and follow-up.
Developed together with 45+ real estate companies
Developed together with 45+ real estate companies
The right tools for a results-driven working method
Insights
Deviations in your key metrics for specific properties that show what you can gain through efforts.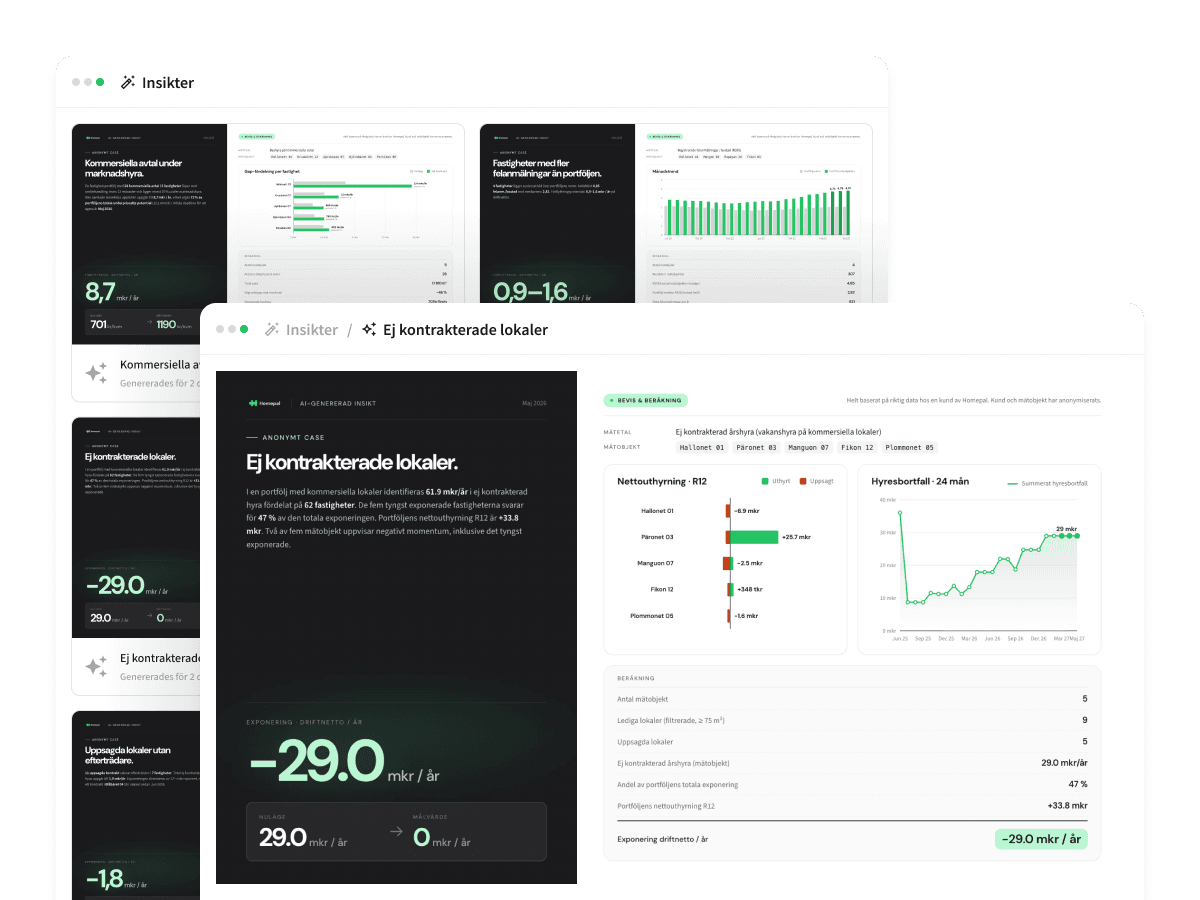
Key metric tree
See how operating net connects to your leading and operational key metrics – in a tree with always up-to-date data.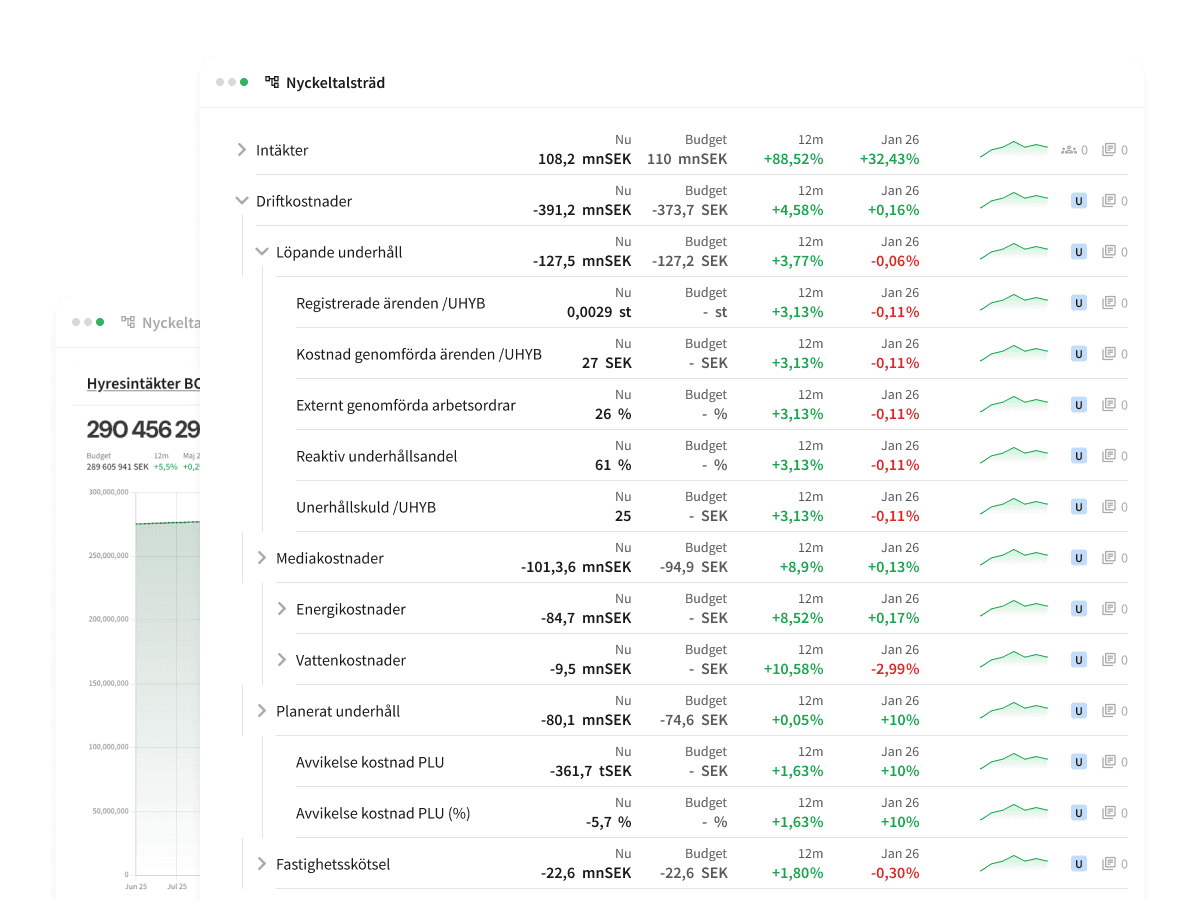
Metrics
Standardised metrics from the industry. Centralised, automated and always up-to-date – directly in the tool.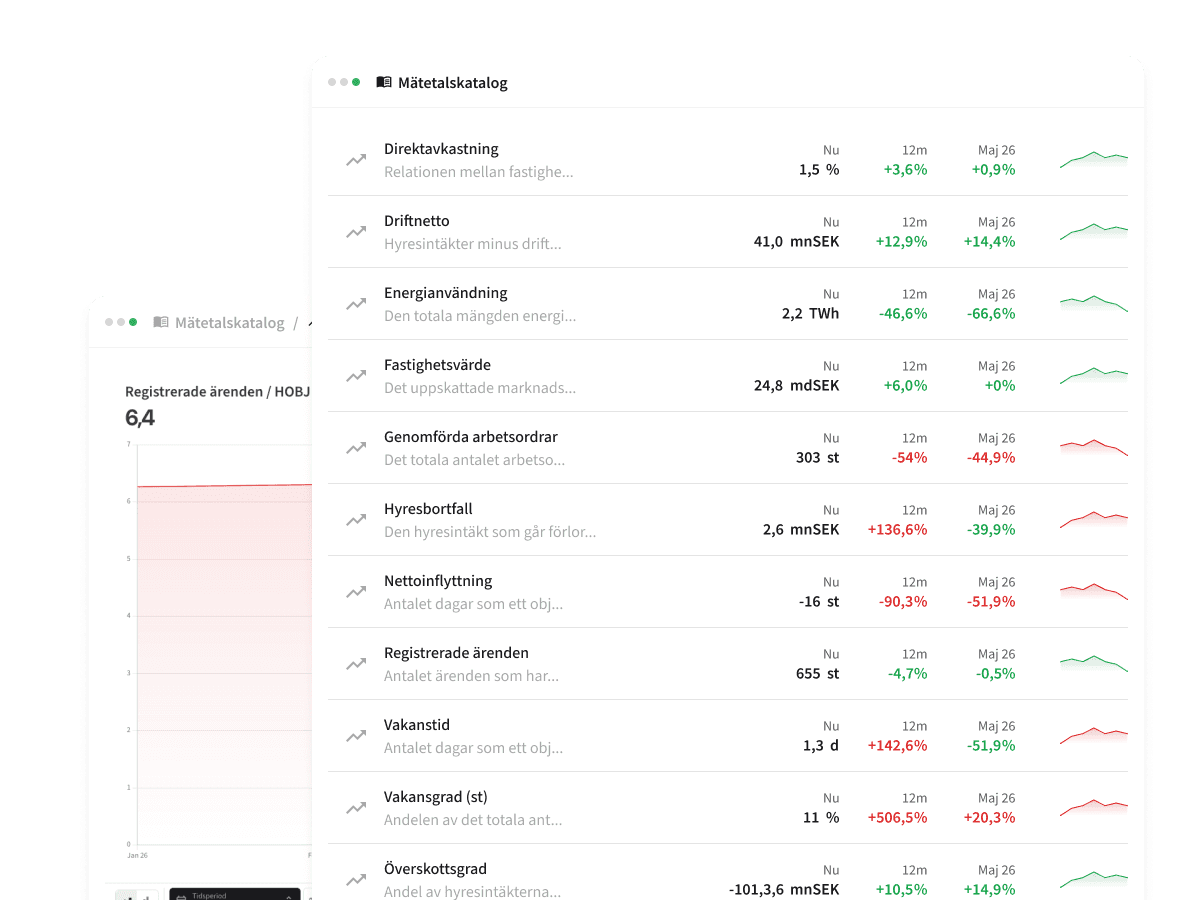
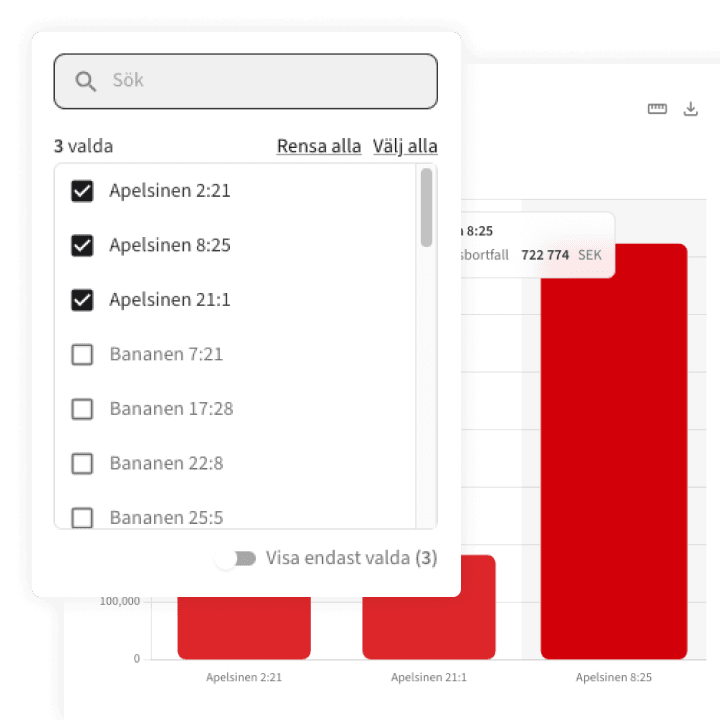
Fast and easy focus
You always decide what is visible – filter and segment according to your specific case.
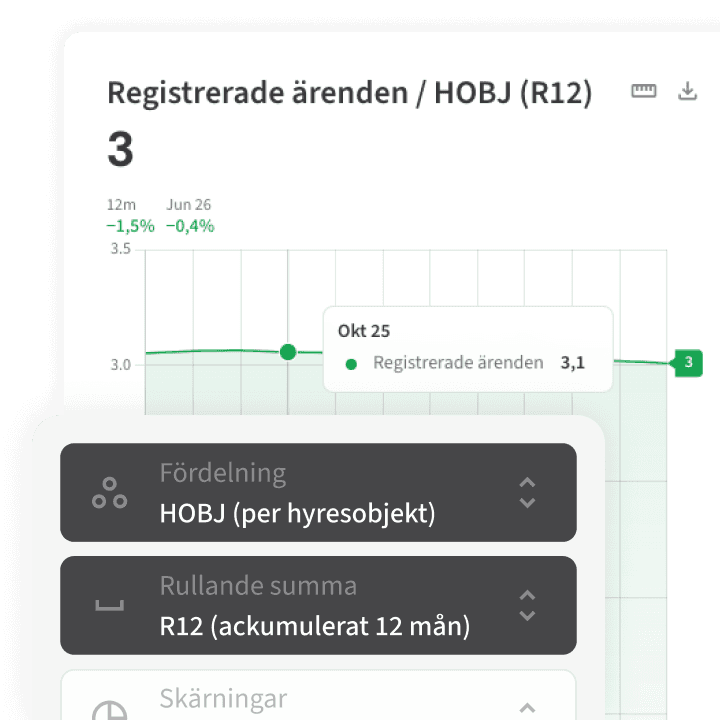
Fair variants
Distribute metrics by comparable unit, or roll it over any period, to get a fairer analysis.
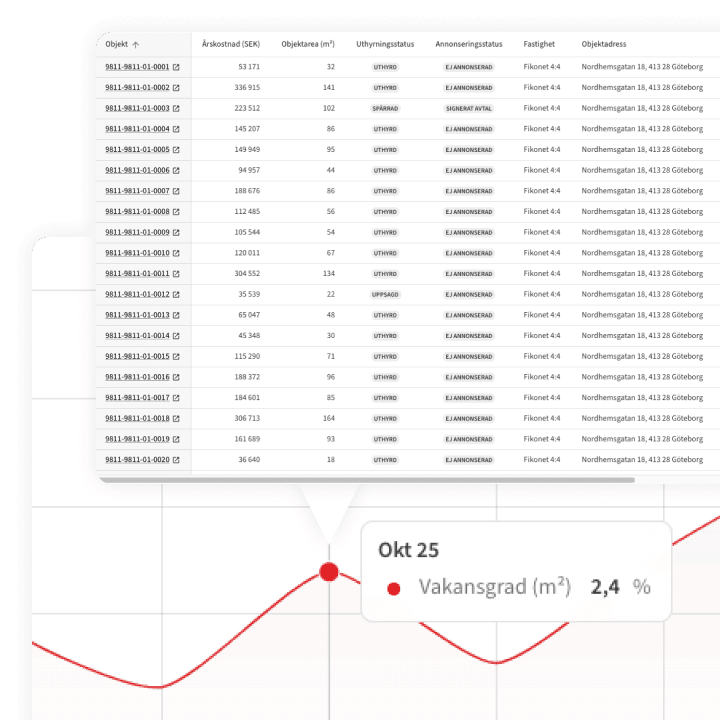
Detailed traceability
Break down a metric level by level until you see which individual lines lie behind the number.
Fast and easy focus
You always decide what is visible – filter and segment according to your specific case.
Fair variants
Distribute metrics by comparable unit, or roll it over any period, to get a fairer analysis.
Detailed traceability
Break down a metric level by level until you see which individual lines lie behind the number.
AI-ready platform