In addition to delivering more KPIs and smart insights to our customers, we’re now putting a strong focus on something often overlooked in traditional BI tools: the user journey. We’re taking a more active role in helping our customers build data-engaged organizations – where getting started is just as easy as diving into analysis.
Through a series of upcoming releases, our goal is to create a platform where:
- Users find relevant information immediately upon login
- Different teams work toward shared goals – regardless of geography
- The most important KPIs are highlighted to create real focus
- Dashboards are used to understand why, not just to report
Why this matters
We’ve collected feedback from users across the real estate industry – through interviews, sales conversations, implementations, and customer support. The message is clear:
“New users need to quickly understand what’s relevant to them – or we risk losing them.”
“We want property managers across regions to work toward the same goals, but right now they’re spread across different dashboards.”
“We need to surface the most important numbers immediately – without too much clicking around.”
These insights are the foundation for the features now on their way into Homepal.
👥 1. Groups, group pages, and a personalized start screen
At the core of many upcoming updates is the concept of groups – for example, Property Managers or Regional Managers. A dashboard can now be assigned to one or more groups, and users in those groups will:
- See relevant dashboards right on their personal start screen
- Have access to a centralized group page with all dashboards tied to their role
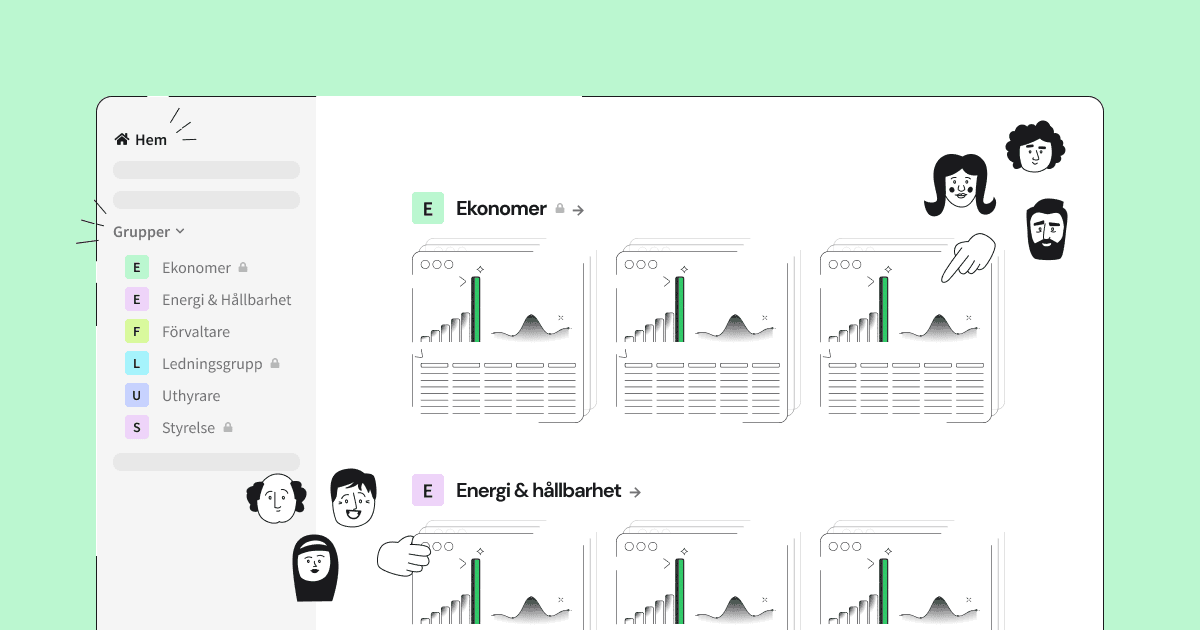
The goal is to make sure new users are presented with relevant data right from the start – and that everyone in a group works from the same foundation.
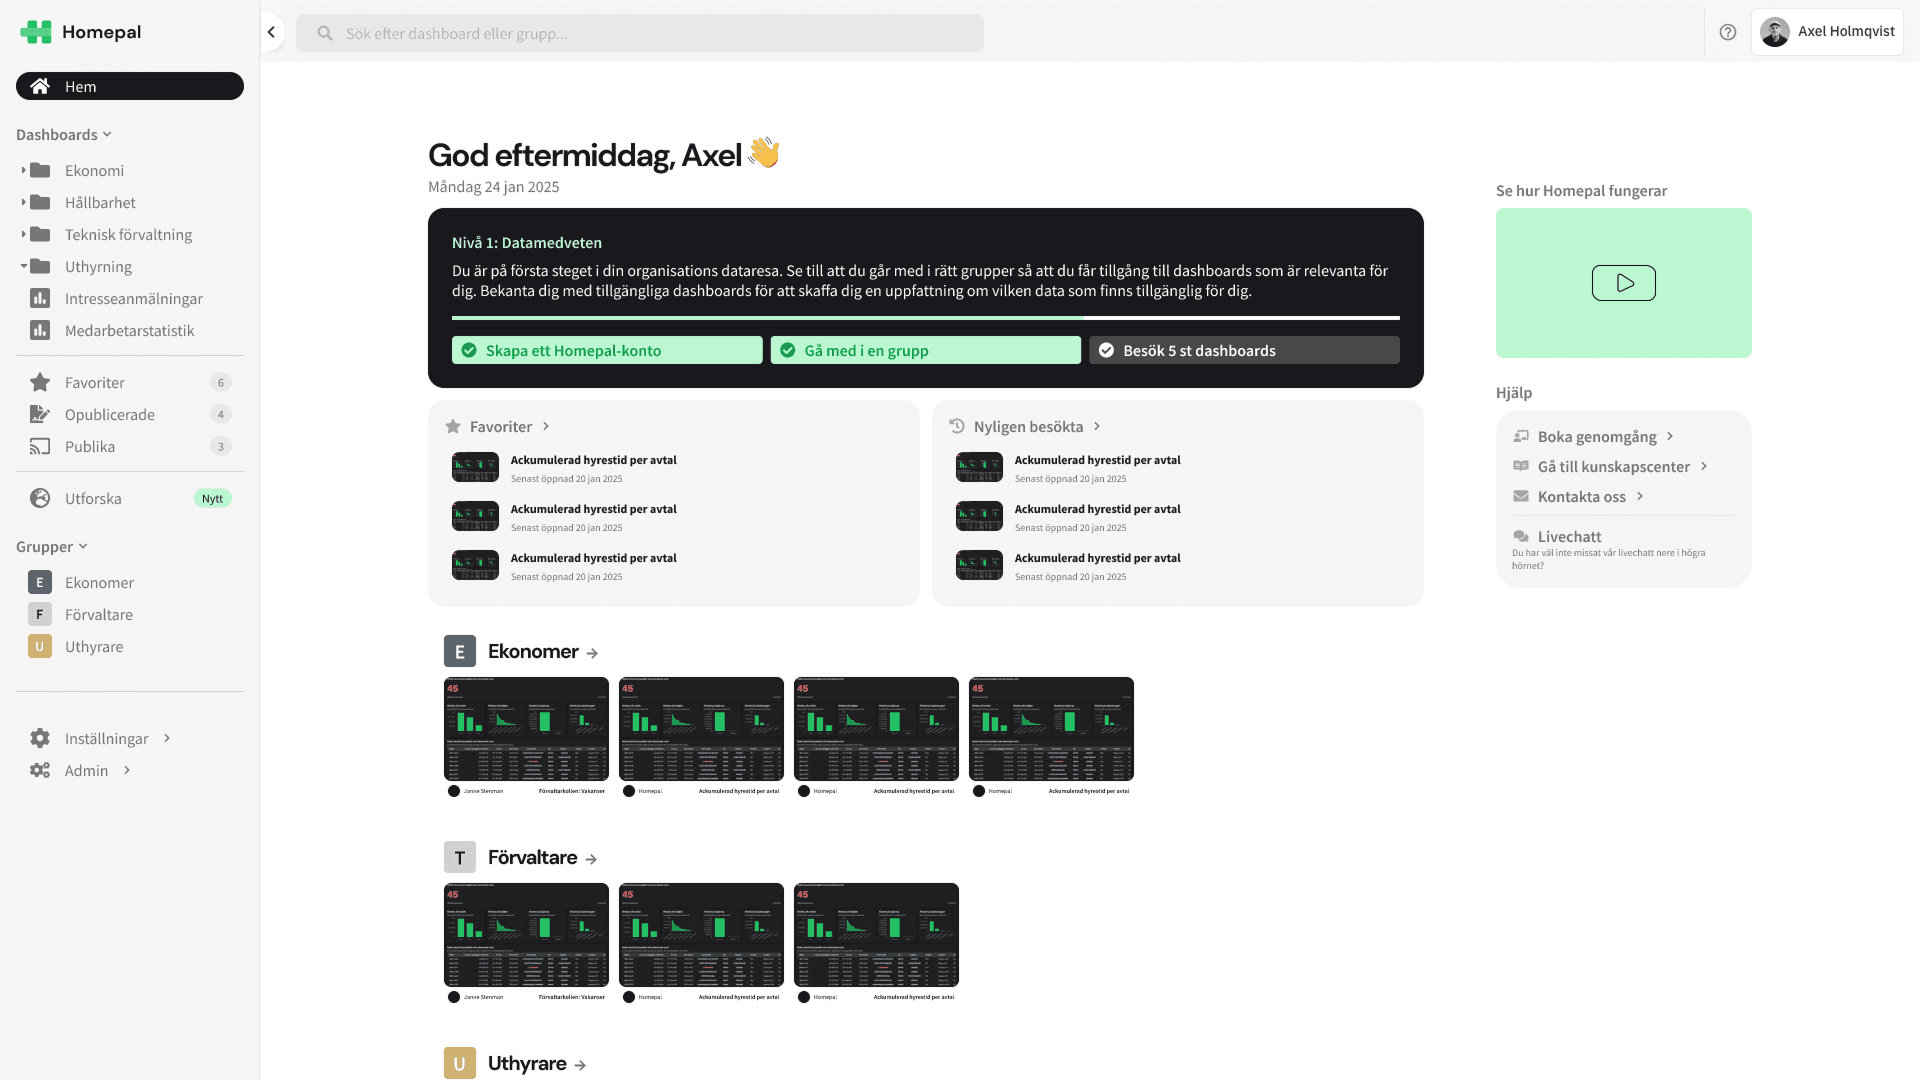
Illustration 1: Home screen showing a user’s groups and their associated dashboards.
⚙️ 2. Company-wide KPI configuration
Until now, KPI definitions have often been embedded in each individual visualization. While it works, it increases the risk of inconsistency and user mistrust. In the next phase, we’ll make it possible to:
- Configure KPIs on a company level, e.g. “What do we mean by residential vacancy rate?”
- Assign an owner to each KPI – someone responsible for its definition and accuracy
This provides better control, more reliable analytics, and enables clearer collaboration around business-critical metrics.
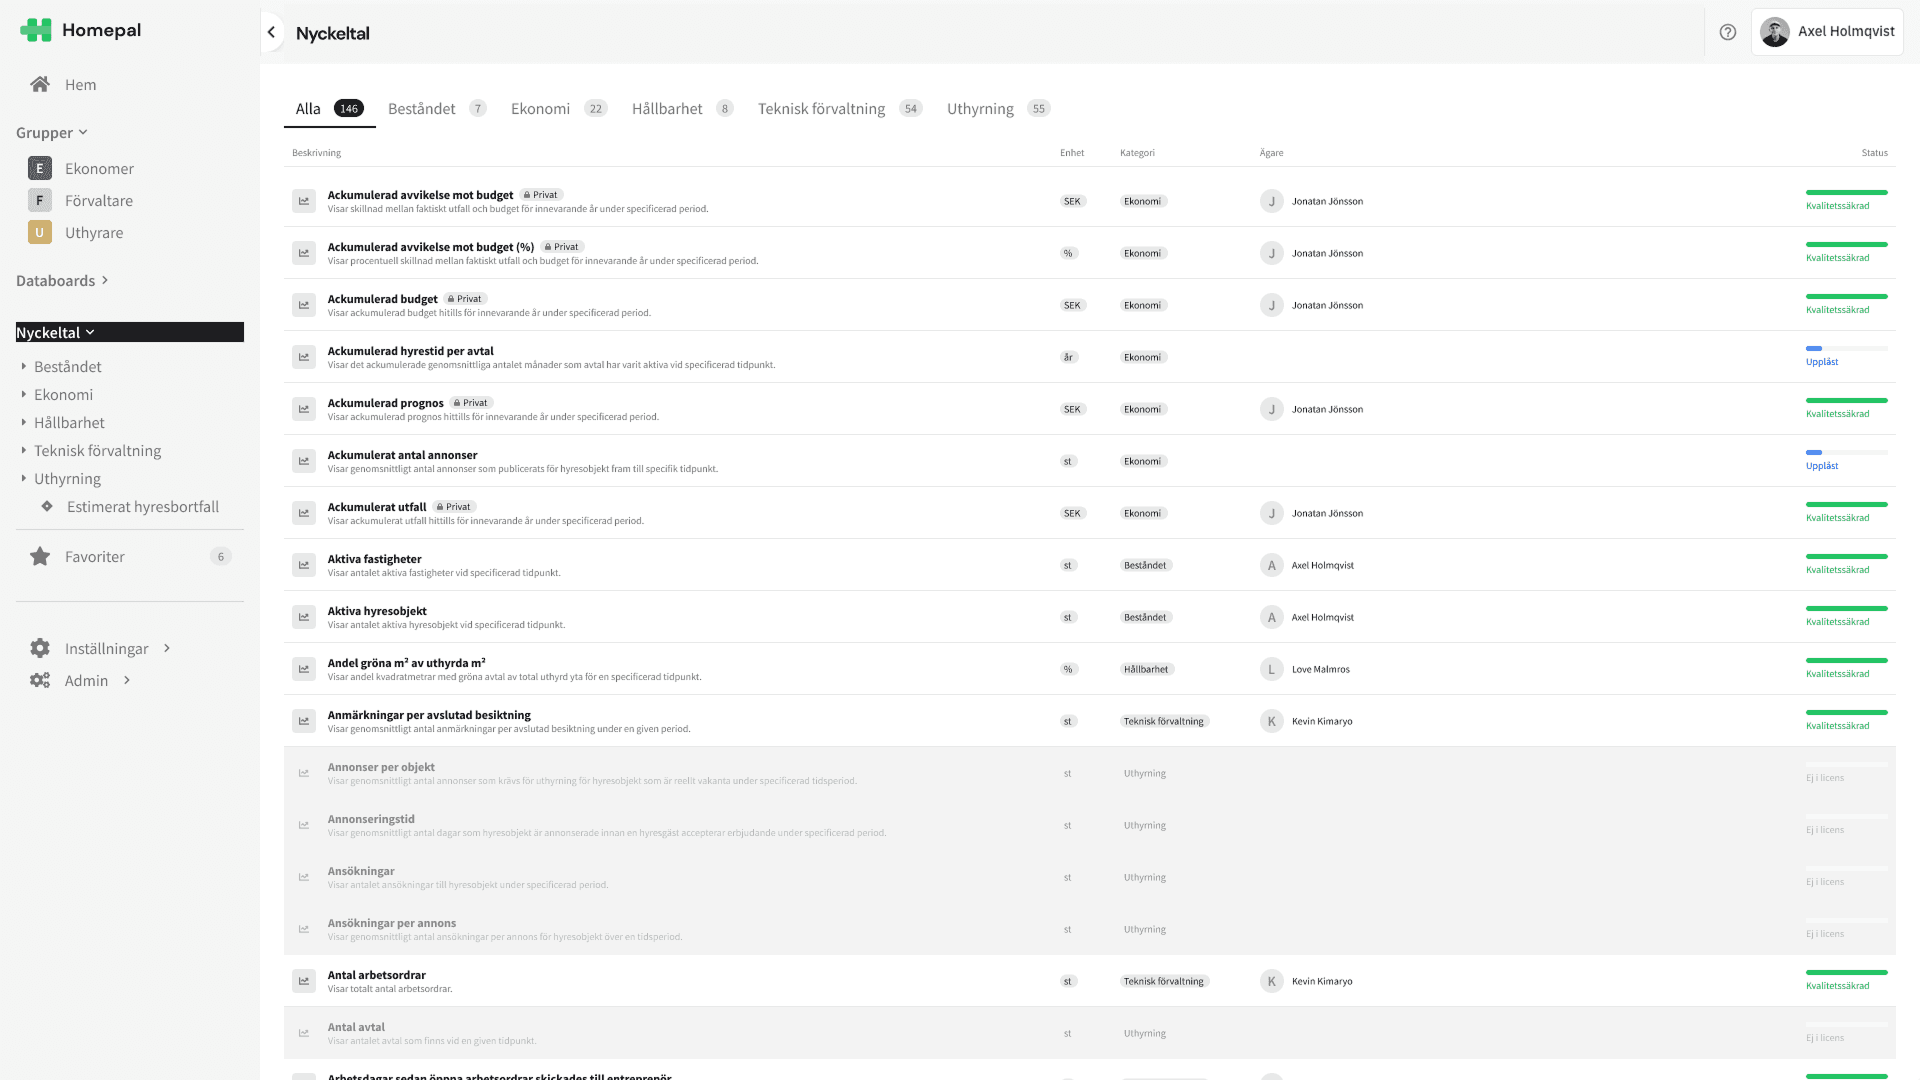
Illustration 2: A common KPI library where new definitions can be created and owners assigned.
📍 3. My geographic area
To make Homepal more relevant from the very first click, users will soon be able to define their geographic area and apply it to all dashboards.
This means no more duplicate dashboards per region – each user will see data relevant to them automatically, without needing to apply filters manually.
📈 4. Focus on key KPIs per group
Each group page will allow highlighting a few selected KPIs, with:
- Current values
- Clear trends
- Optional targets
This brings a new level of clarity: What are we working toward – and how are we doing?
Dashboards then serve as a natural next step to explore why something deviates, rather than just listing all the numbers.
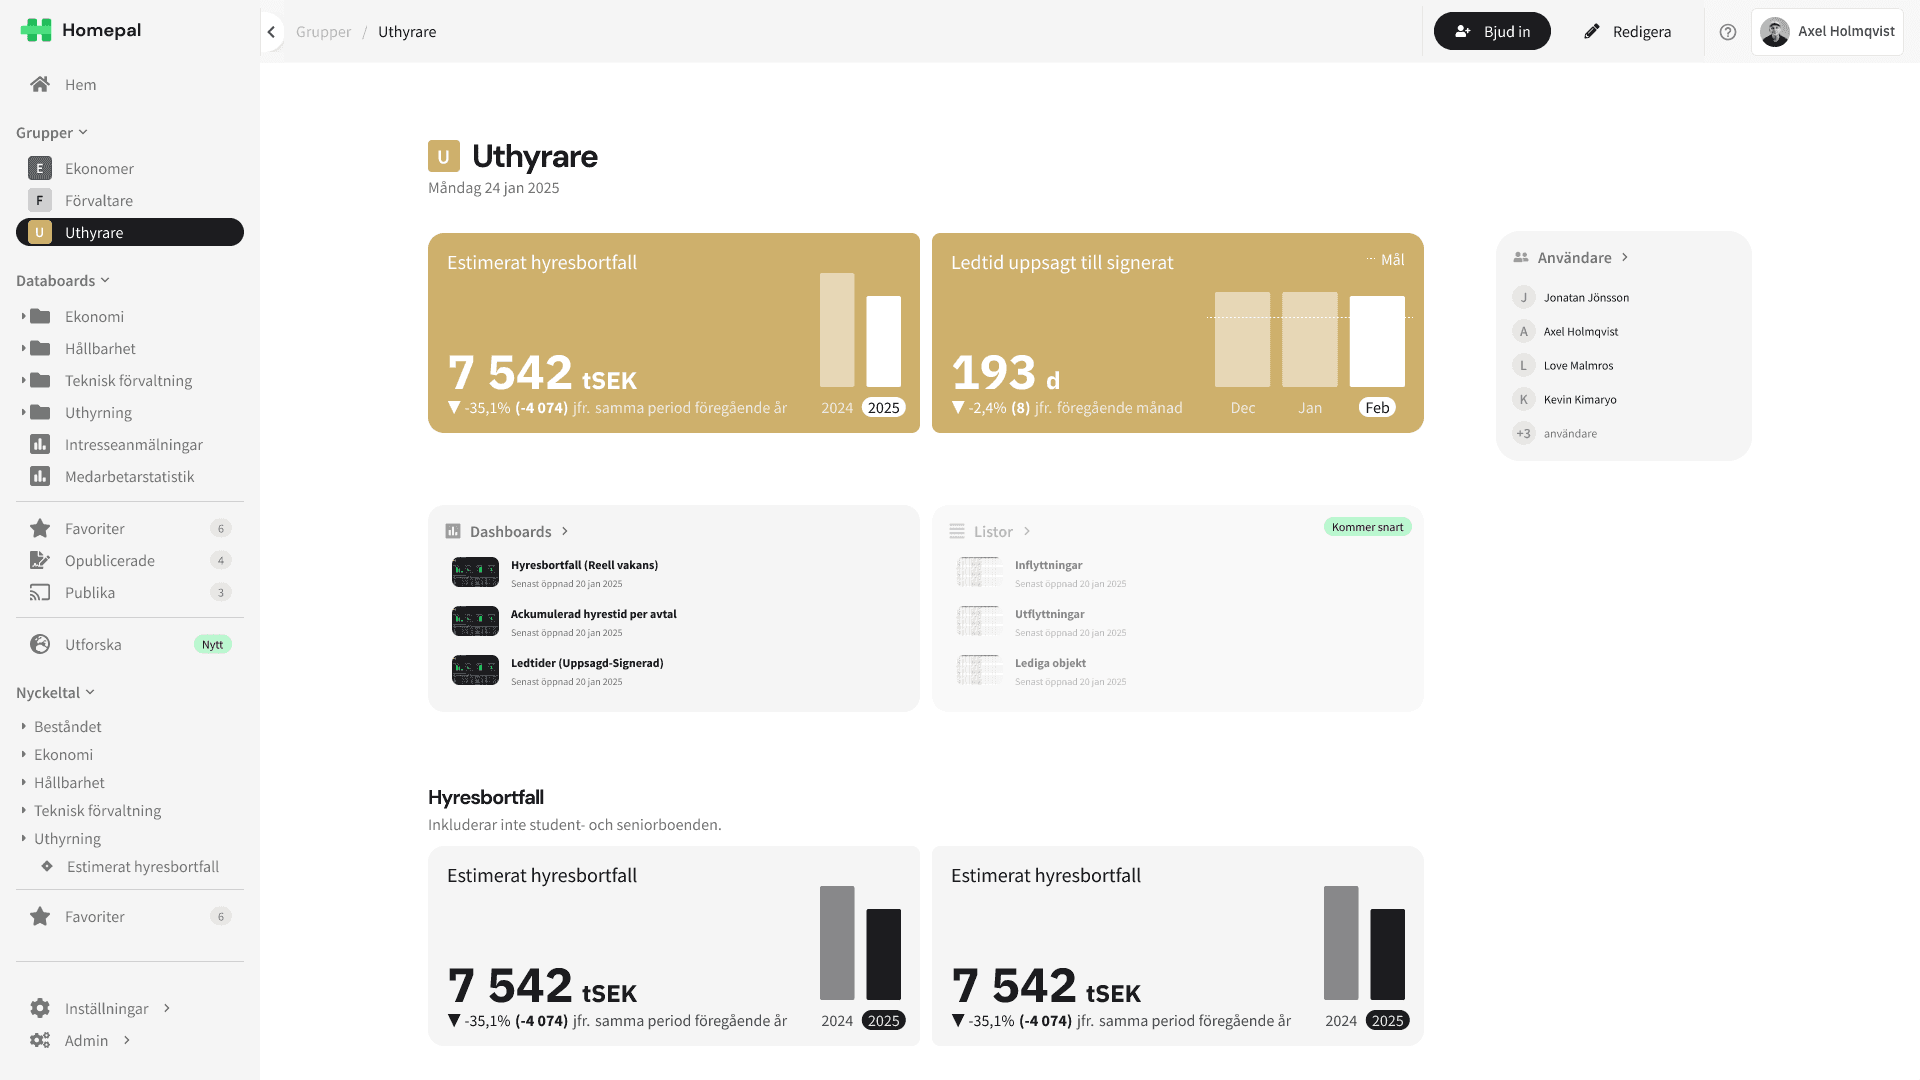
Illustration 3: Users in a group get an immediate overview of their most important KPIs to establish clear focus.
Let us help you set up your groups and ensure that every user lands in the right place from the very first click. We’re happy to assist with defining target audiences, selecting KPIs, and creating a smart structure tailored to your organization.
👉 Reach out to your Homepal contact or support@homepal.se and let’s get started!