Dashboards Are Designed for Analysis – Not for Reporting
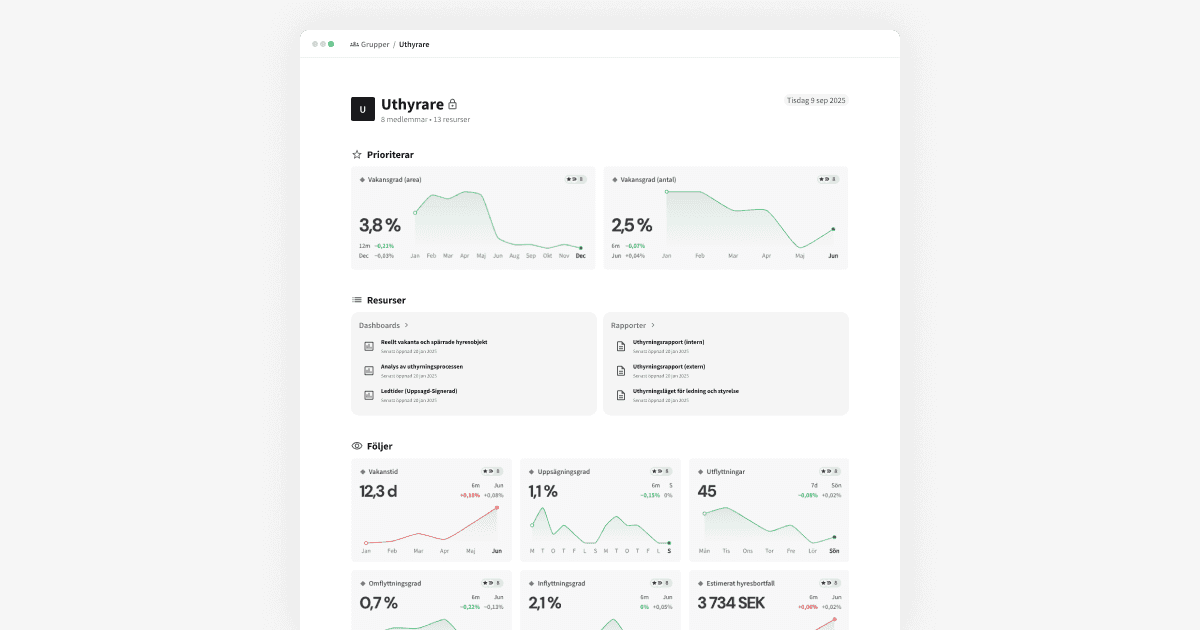
Dashboards, whether built in Homepal, Power BI, or any other platform, are fantastic tools for ongoing analysis. They update continuously, make it easy to filter and compare data, and help organizations react quickly to changes. This real-time nature makes them invaluable for operational decision-making – tracking maintenance, leasing, energy use, or service requests. But the very thing that makes dashboards so powerful for everyday use also makes them less suited for reporting.
Reporting is not about showing the latest data; it’s about documenting what actually happened during a given period – and what conclusions were drawn from it. In a dashboard, data changes all the time. New invoices are registered, leases are signed, readings are updated – meaning the numbers you saw yesterday might not be the same today. When reporting forms the basis for management or board-level decisions, stability, context, and traceability become critical. It’s not enough to show how things look right now; leaders need to understand how things looked then, why they looked that way, and what was decided as a result.
That’s where dashboards reach their limit. They show numbers, but not the story. They give a snapshot, but not the version that supported last month’s decision. And most importantly, they don’t provide space for discussion, reflection, or shared understanding.
Reporting Is About Understanding and Decision-Making
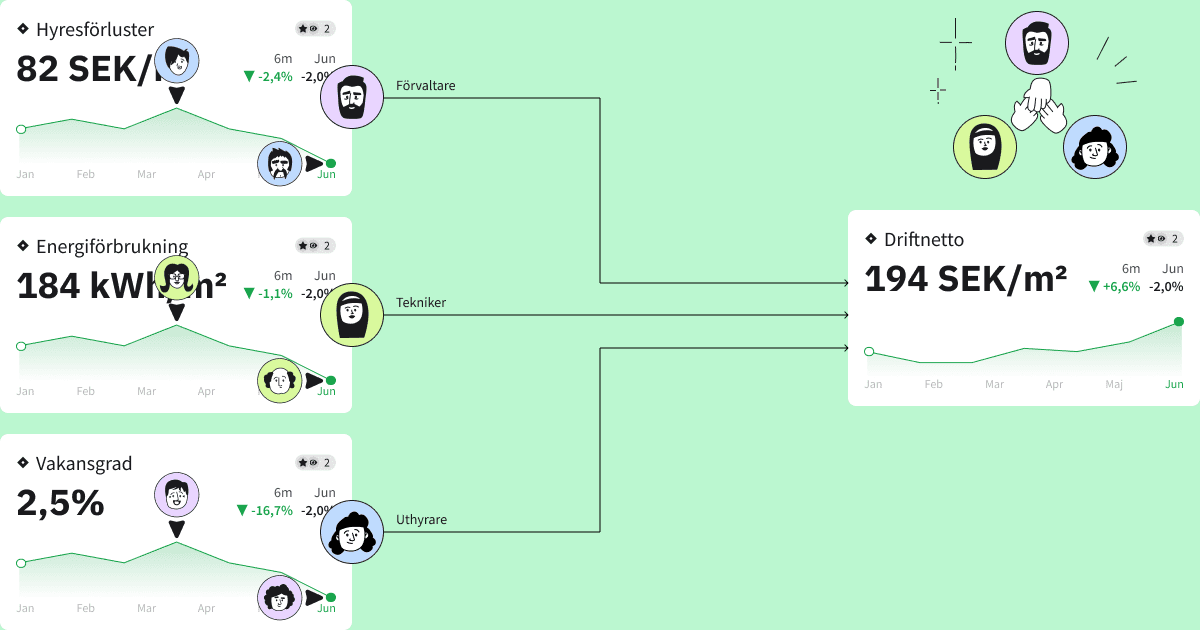
When data moves up to management level, the purpose changes. It’s no longer about exploring metrics but about creating a shared understanding of what happened – and deciding what to do next. A report, in that sense, is more than a collection of charts; it’s a decision framework that combines data, context, and communication.
Today, that process is often manual. Data is exported from BI tools, pasted into PowerPoint or Excel, commented on, revised, and sent around multiple departments. It’s a time-consuming cycle that produces several versions of “the truth” and makes it difficult to maintain traceability. Meanwhile, property companies have already invested heavily in BI solutions and data platforms that contain all the information needed to create these reports. The challenge isn’t data access – it’s how to use it in a way that truly supports decision-making. Dashboards help explain what’s happening; reporting explains why and helps determine what to do next.
A New Interface for a New Purpose
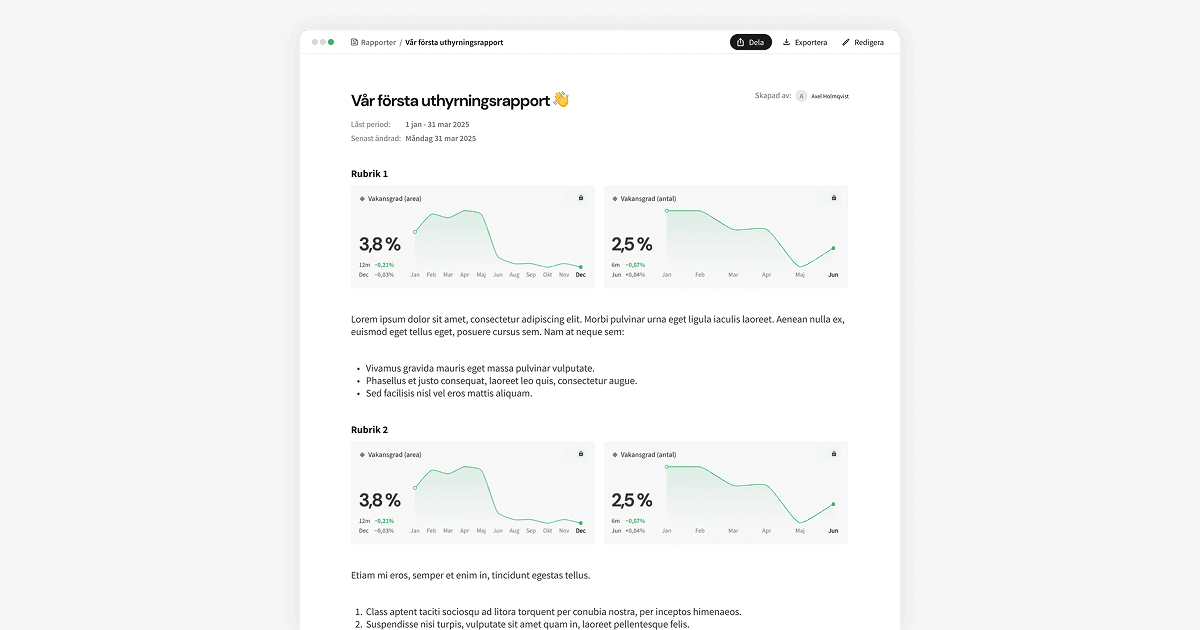
We’re currently developing a new interface in Homepal – designed for a completely different purpose. This isn’t about exploring live data, but about creating context, documenting decisions, and giving managers and executives a stable foundation to act on. The new interface will build on the same trusted metrics and data models used in Homepal dashboards but with entirely new capabilities: locking data by period to ensure consistency, commenting and explaining results directly in reports, and tracking decisions over time.
The idea is simple: the same reliable data that powers analysis should also power decision-making – without ever leaving Homepal. By bringing reporting, context, and dialogue together in one environment, the decision process becomes faster, clearer, and more transparent. Reports stop being static documents that live outside the BI system and instead become a natural continuation of data-driven work.
From Analysis to Leadership
This is the next step in Homepal’s journey. We’ve made it easy for property companies to follow up on their key metrics through dashboards and analytics. Now, we’re taking the next leap – helping them make better decisions based on the same trusted data. Dashboards will always have a vital role in understanding performance, but they’re not enough for steering an organization forward. To truly become data-driven, companies need a space where insights gain context, decisions are documented, and reporting becomes part of continuous learning.
Our vision is for reporting to no longer be a manual export at the end of the month, but an integrated part of Homepal – a place where data meets dialogue, and where analysis naturally leads to action. Because in the end, reporting isn’t about looking back. It’s about understanding enough to make better decisions moving forward.