Stockholmshem is now placing 400–500 fewer orders per month than before, which has saved them 10 million kronor in just six months. But none of those figures appeared in the financial statements at first. They were hidden in the data behind the operating net income, long before the annual report was even started.
That’s how it works for most people. Net operating income tells you how things went, not what you should do tomorrow, and by the time a decline becomes visible there, it has usually already been going on for several months.
A tree that shows what actually drives the figure
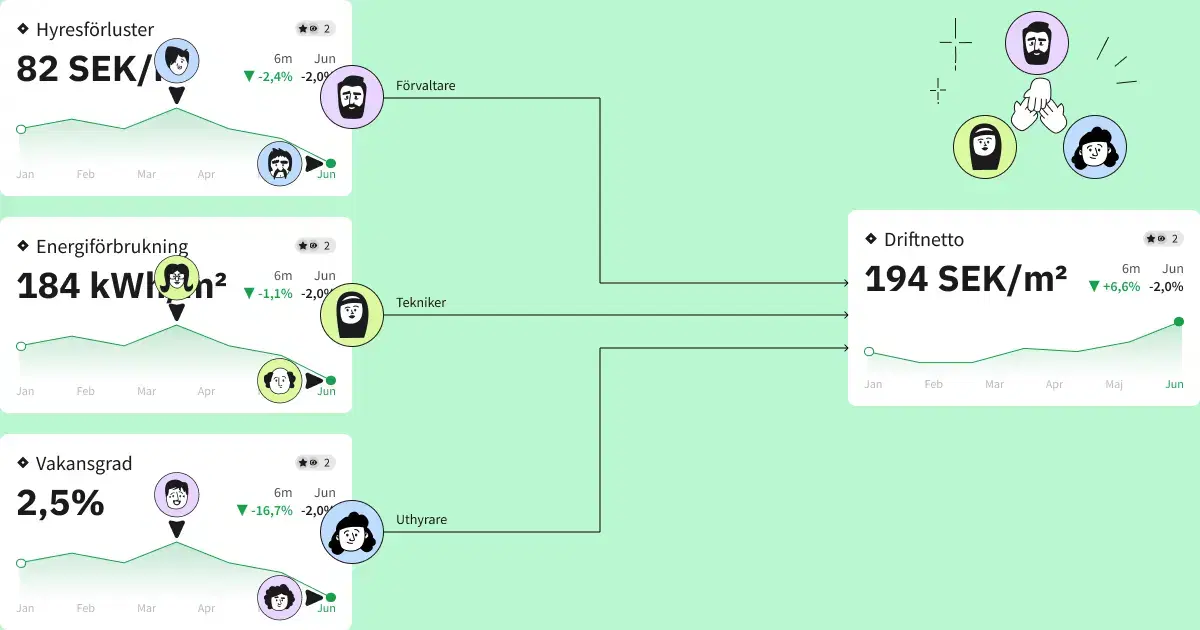
The solution we’ve developed is based on a simple assumption: net operating income is always influenced by a number of underlying key metrics—rental income, vacancy rate, maintenance costs, energy consumption, and so on. The only question is how much, and when the effect becomes visible.
The key metric tree makes that connection visible, and instead of flipping through separate reports, you see the entire chain at a glance: which key metrics make up net operating income, how they’re interconnected, and which ones are currently pulling in the wrong direction. Since the tree is versioned, you can also go back and see what the structure looked like six months ago—for example, if you’ve changed how something is measured.
From Numbers to Action
Let’s say a property’s net operating income is below budget. Without the tree, the next step is often a manual investigation, where someone digs through Excel, compares the numbers to last year, and ultimately guesses at a likely cause. With the tree, you can immediately see which branch is deviating—perhaps maintenance costs have skyrocketed, while the revenue side looks completely normal.
So you don’t just know that something is wrong—you know exactly where. That difference allows you to take action weeks earlier, instead of discovering the problem in the next quarterly report.
Why It Matters
We’ve completely revamped the way we work with net operating income around this idea—moving from simply tracking the metric to actually understanding and influencing the factors that drive it. The KPI Tree is one of the cornerstones of this approach.
Want to see how the KPI Tree works in Homepal? Book a demo →