“The faucet in the kitchen is dripping.” “It's cold in the bedroom; it's been like that for about a week.” “The lights outside the entrance don't work; you can barely see anything when you go out.” This is what reality looks like in most work order systems—free-form text, written on the fly, rarely the same way twice. And that’s exactly what makes it difficult to do anything meaningful with it.
The data is there, but it can’t be analyzed
A real estate company with a few thousand apartments accumulates tens of thousands of lines like these every year. Each one describes a real problem, but none of them is structured in a way that allows for comparison. “Dripping,” “leaking,” and “running” can mean exactly the same thing, yet the system treats them as three different words. So if you want to identify patterns—which properties are most frequently affected by water damage, which issues recur within three months of a repair—you either have to go through everything manually or just ignore it.
Most property management companies choose the latter. Rarely because they lack interest—rather, because there simply isn’t enough time.
What the AI Actually Does
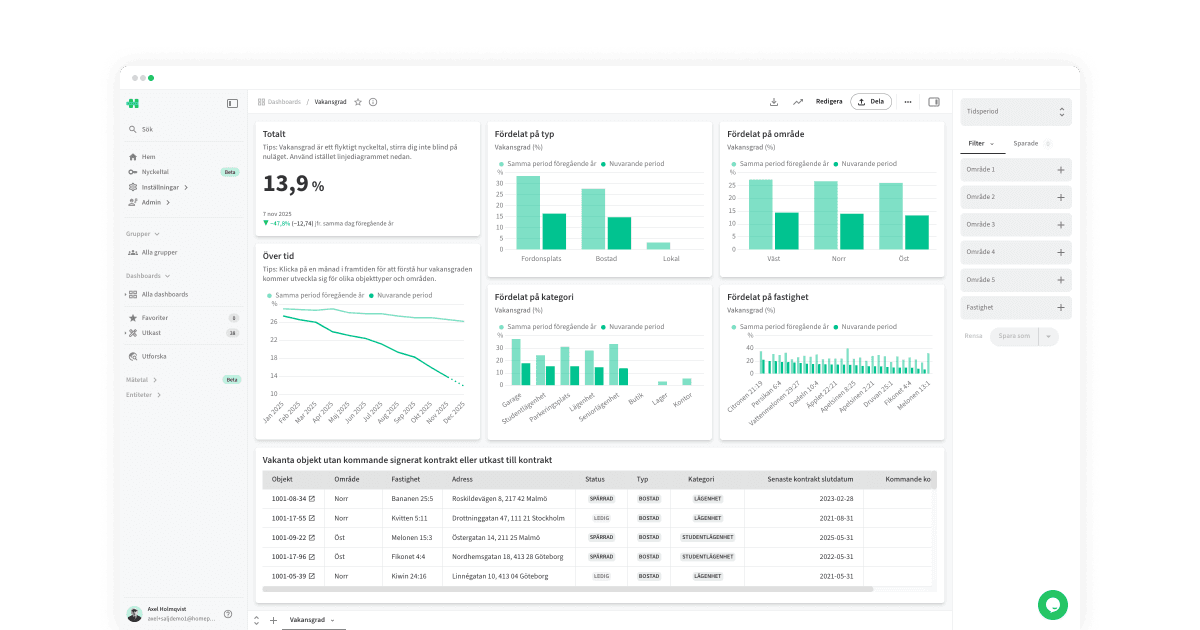
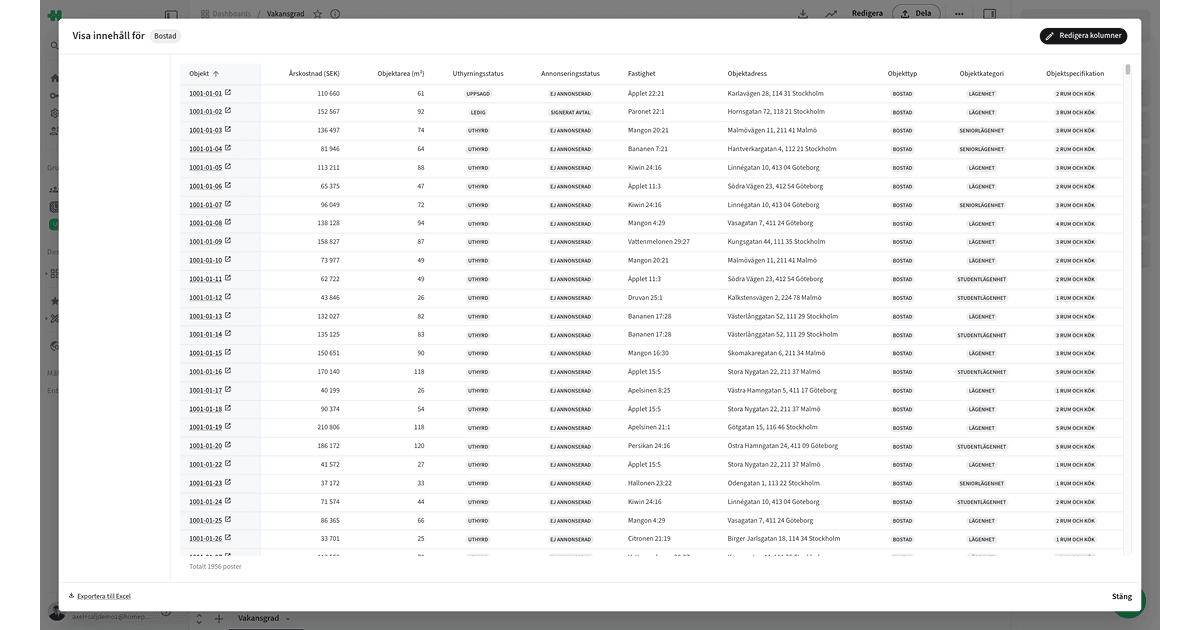
What we’ve built takes that free-form text and structures it, without anyone having to manually rewrite a single case. The system reads the content of each work order and tags it based on category, probable root cause, and severity, then links it to the correct property and apartment. Suddenly, “leaky faucet” and “water leak in the kitchen” can be classified as the same type of issue, no matter how differently they were phrased originally.
We’ve developed this in close collaboration with Olov Lindgren, who has tested, challenged, and helped shape how the categorization actually works in day-to-day operations—not just in theory. That’s the difference between a tool that looks good in a demo and one that actually holds up when thousands of real cases pour in every week.
What this means in practice
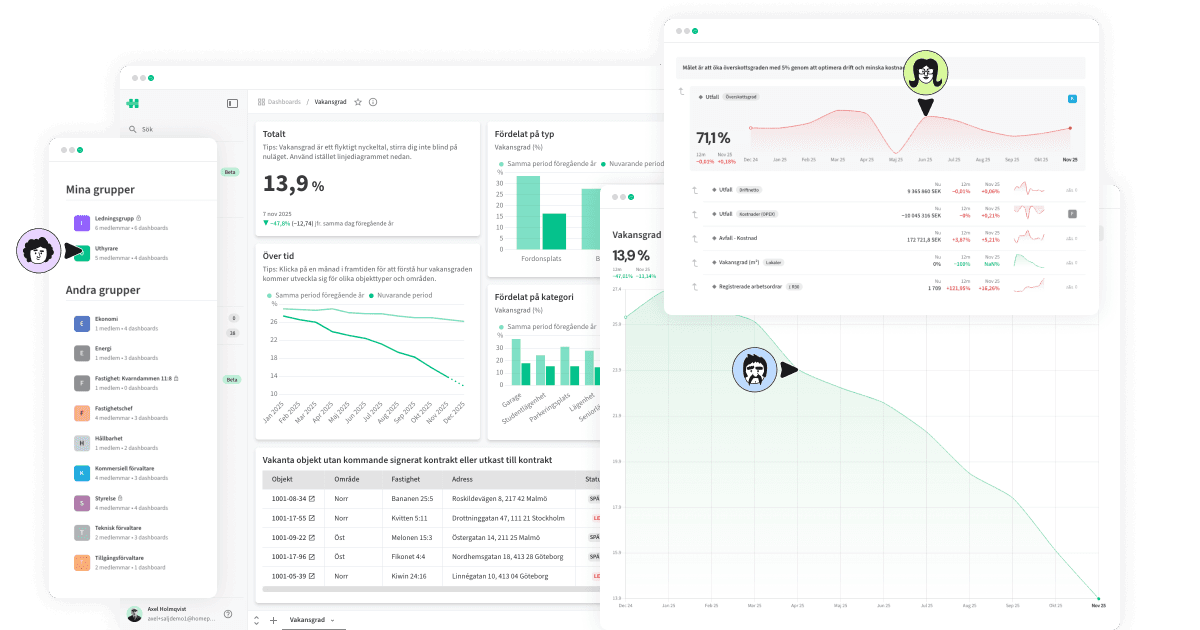
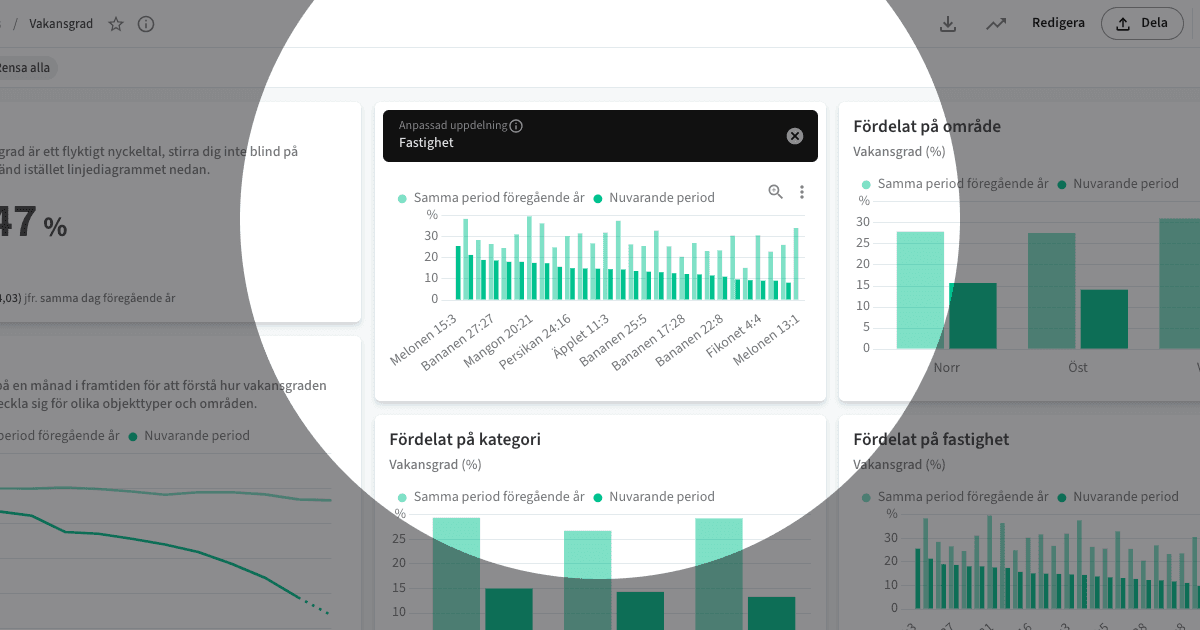
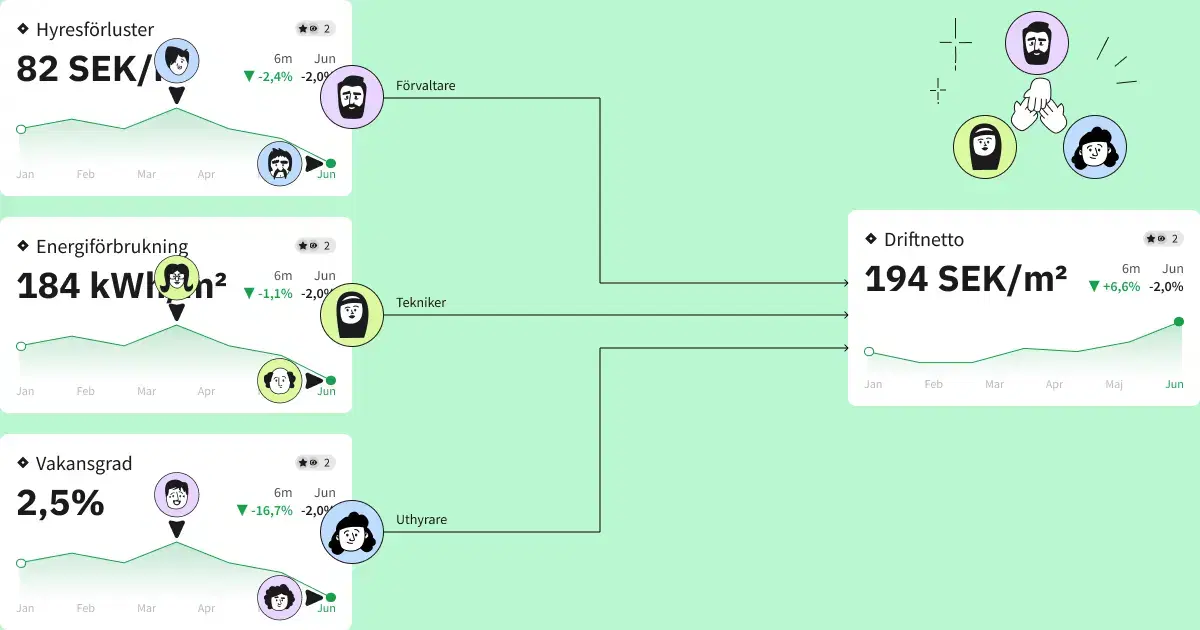
Once work orders are structured, they can be analyzed effectively. You can see that a particular property has three times as many HVAC-related issues as the portfolio average. You can discover that issues classified as “resolved” recur within six weeks much more often than expected. And, for the first time, you can directly link these types of patterns to net operating income—since recurring issues rarely cost just time, but money as well.
Sometimes the pattern has nothing to do with money at all. A broken outdoor light at the entrance is usually logged as an electrical issue, period—someone replaces a light bulb, and the case is closed. But put that next to a report about an untrimmed hedge blocking the view further away on the same property, and a report that the bike rack feels dark in the evening, and a clearer pattern emerges: three separate cases that together point to the same safety issue, spread across the property. AI enrichment tags all three based on what they’re actually about—electricity, grounds, and lighting—but also adds “safety” as a separate layer on top—which makes the pattern visible even when the cases come in at completely different points in the system, weeks apart, from different residents.
No single fault report tells that story. Only the pattern does, when enough of them are viewed together.
Want to see what this looks like for your portfolio? Book a demo →