Advanced Comparison of Net Operating Income-Affecting Costs

Dashboard image

This dashboard is designed for those who want to identify properties with both high relative and absolute costs to maximize the impact of efficiency improvements.

Who is watching it?

Controller, Finance Manager

How often?

Monthly

Why you should use the dashboard?

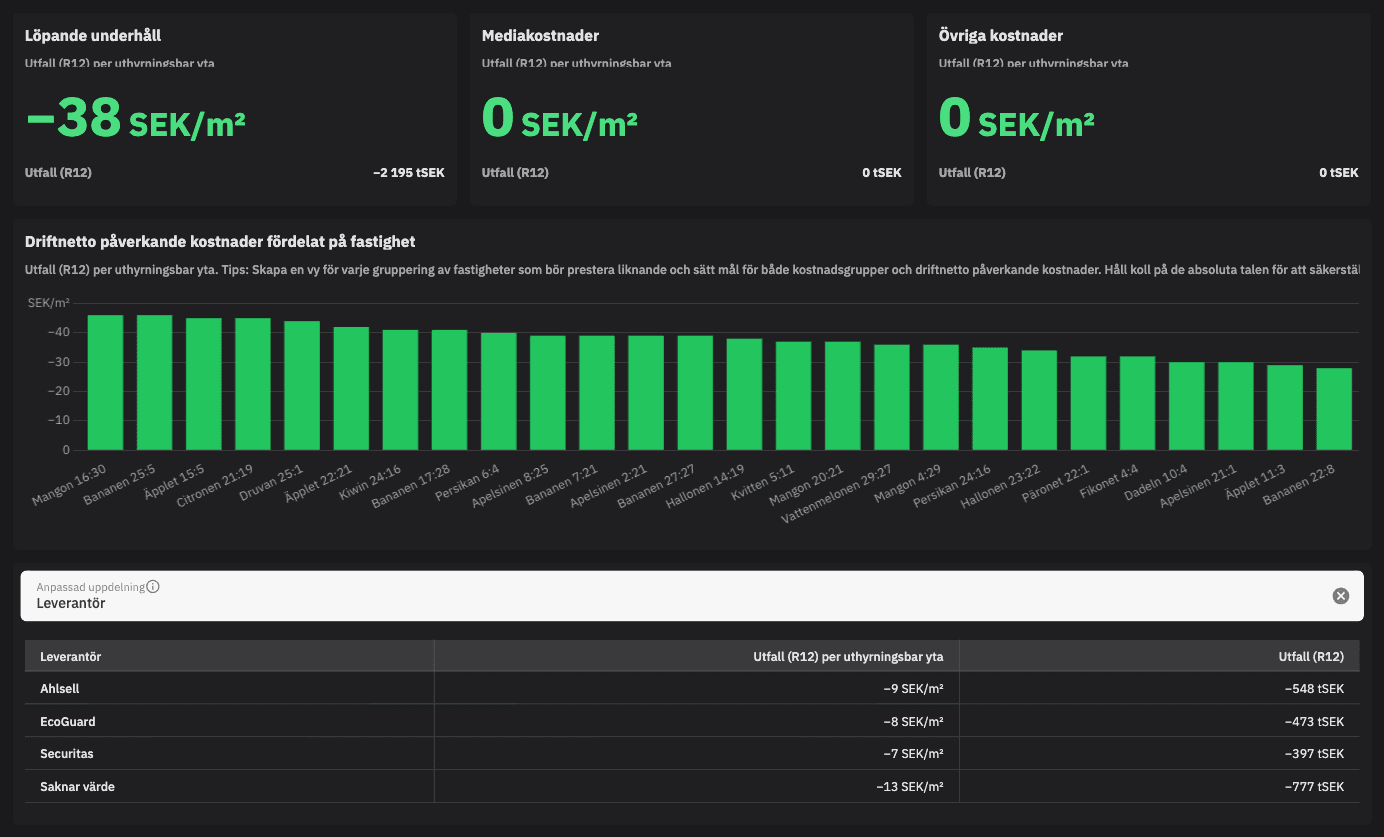
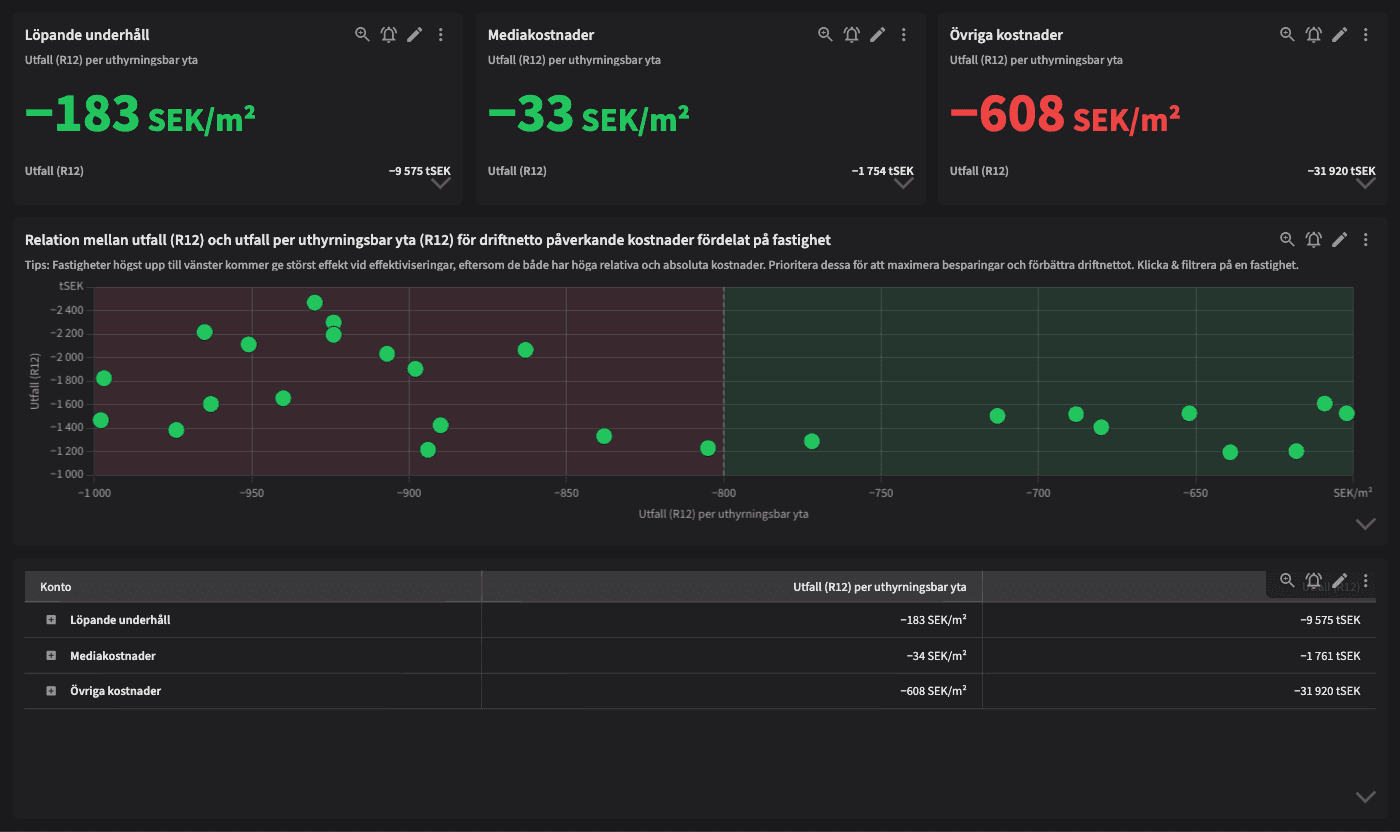
Advanced Comparison of Net Operating Income-Affecting Costs expands on the "Comparison of Net Operating Income-Affecting Costs" by featuring a bubble chart that combines both relative values per property (per rentable area, R12) and absolute values per property (actuals, R12). This provides the user with a unique opportunity to identify properties that are most expensive when compared on a relative basis, as well as which of these properties have the highest absolute costs. This allows for prioritizing efficiency improvements where they will have the greatest impact.

Hints!

Check out the bubble chart! Properties in the top left will yield the greatest impact from efficiency improvements, as they have both high relative and absolute costs. Prioritize these to maximize savings and improve net operating income.

System examples

Economy
Commercial company
Housing company
Management company
Created by Homepal
This dashboard is created and modified by us at Homepal using our own, made up demo data. The concept and idea comes from discussions and work with one of our customers.

Join your industry colleagues


Integration logotype

Enter thenext generation

No gigantic IT project, no system change, no consultants. Activate an add-on solution that has already been refined for many years and with thousands of players in the real estate industry.

Industry Leader
Real Estate
Pioneering Proptech and Sustainable Innovation in Sweden 2024
Integration logotype