Metrics
All data collected in one place. Our metrics catalog gives the entire organization a common and reliable truth in numbers.
What are metrics?
Metrics — and the catalog that holds them — are the core of your analytics in Homepal. This is where all numbers in your organization are defined, structured, and managed.
How it works
Each metric in Homepal has a definition, calculation logic, and possible variations. You decide which metrics are visible, private, or central to your organization. All dashboards and key metrics fetch their data from here — ensuring your numbers are always consistent everywhere.
All metrics in Homepal are created and maintained by us. This approach enables an industry-wide standard, making it possible to compare results across organizations. Every metric is based on suggestions and collaboration with our customers ⭐ — and once approved, it becomes available to everyone. If your organization is missing something, we’d love your input!
How to use this feature
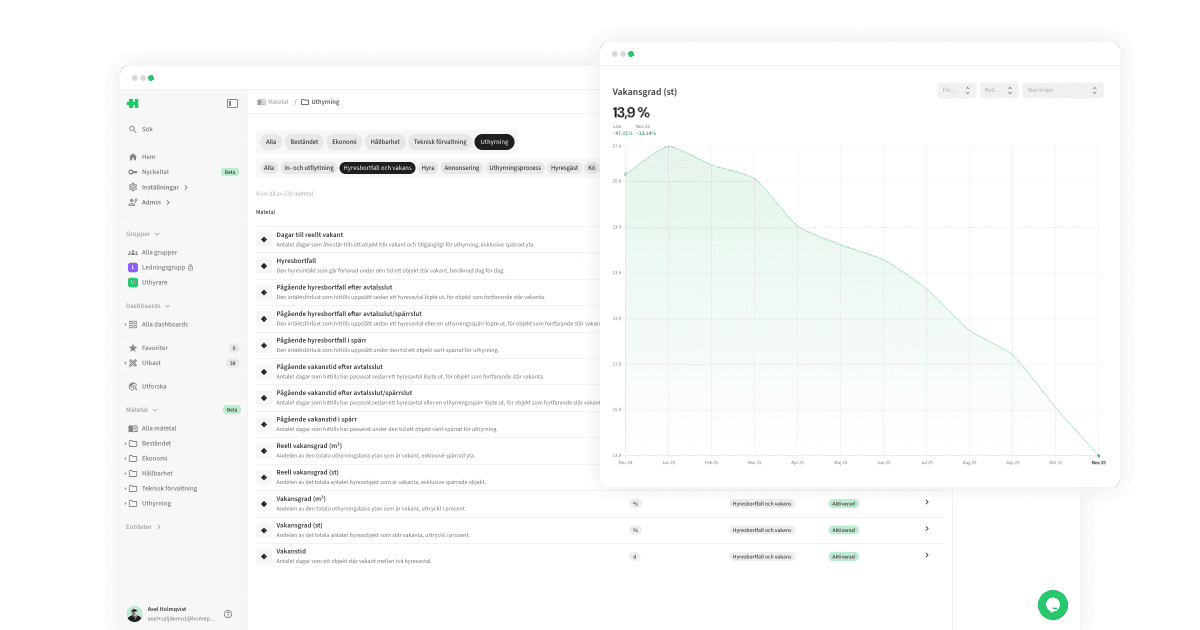
Catalog
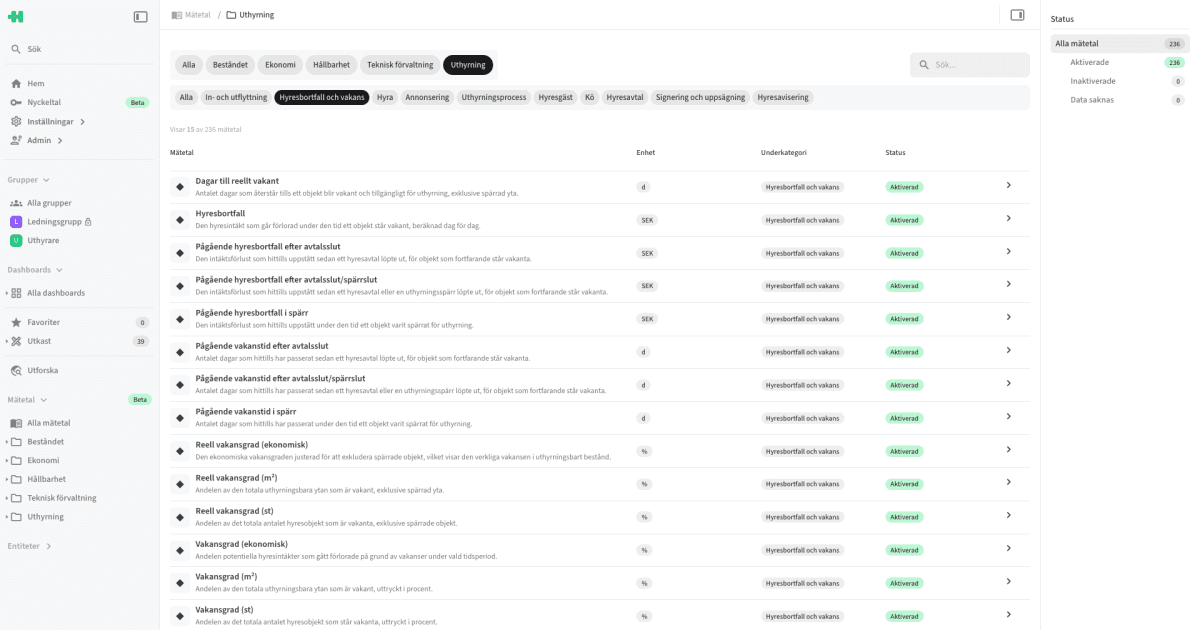
The catalog lists all available metrics within your organization.
System administrators can view all metrics and activate or deactivate them in the metric’s settings→
Click a metric to read more about it or to explore its data further.
The same catalog is used when adding metrics to dashboards, key metrics, or groups.
Overview
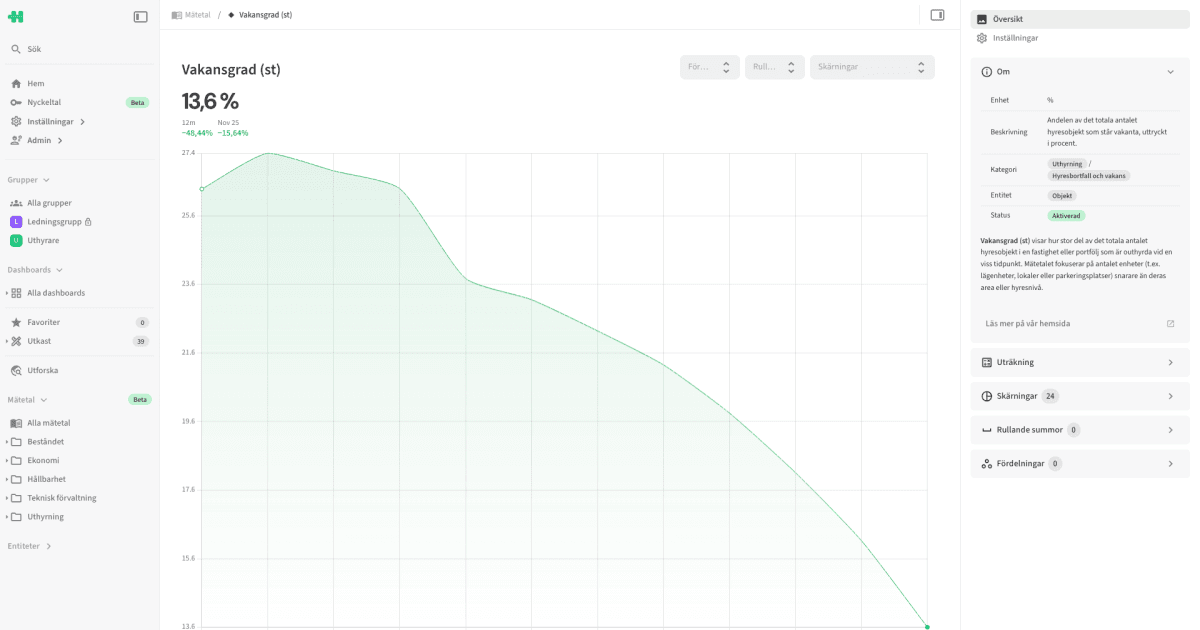
The overview shows the metric’s value over the past year.
Here you can:
Apply a distribution to enable fairer comparisons or trends,
e.g., per object, per m², per Atemp, etc.
See more under distribution→
Apply a rolling sum for smoother long-term trends,
e.g., R7, R30, R365, etc.
See more under rolling sum→
Apply one or several slices to focus on a specific part of your data,
e.g., Residential, External, Blocked, etc.
See more under slice→
In the right-hand sidebar, you’ll find the metric’s definition and calculation, along with available slices, rolling sums, and distributions.
Note: The overview is meant as a quick summary. For deeper exploration, we recommend adding the metric to a dashboard.
Settings
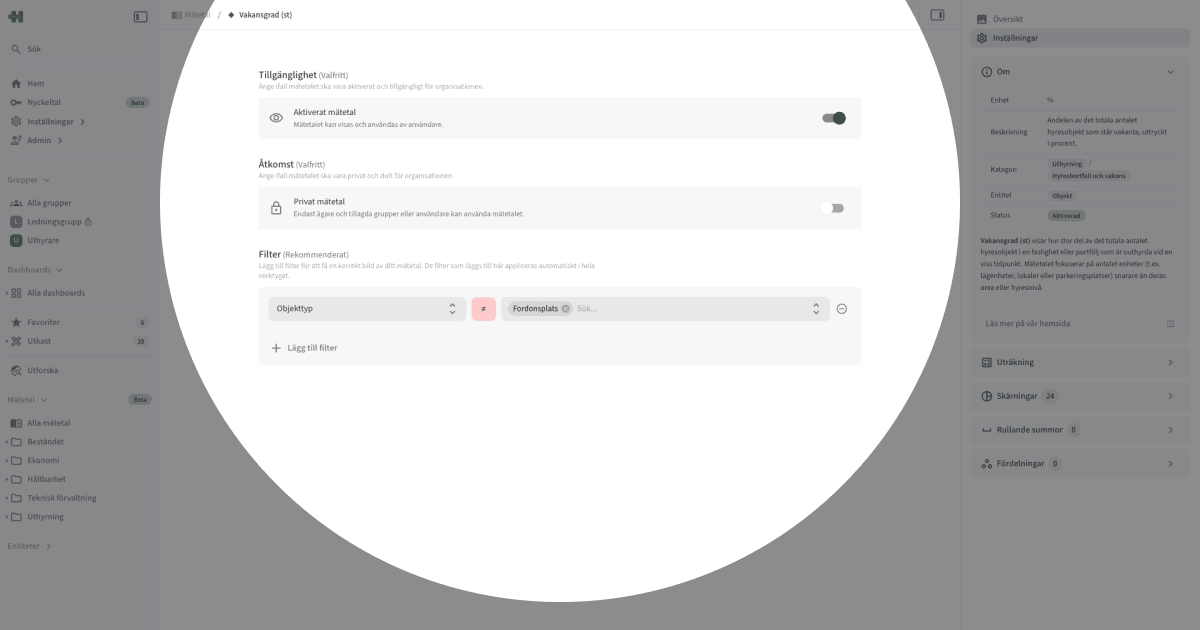
In a metric’s Settings, you can:
Manage availability
Activated metrics can be used across the organization.
Deactivated metrics are hidden for everyone.
Manage access
Public metrics can be viewed and used by all users.
Private metrics are only available to invited users or groups.
Add central filters
Exclude data that should never be included for this metric in your organization — no matter what.
Distribution
In Homepal, every metric can be distributed per selected unit.
This makes it easier to compare or track changes over time in a fair and standardized way.
Each metric can display its value per:
object:
HOBJspace:
SPCunit:
UNTbostad:
BOSrentable sqm:
RNTBrented sqm:
RNTDheated sqm (10°C):
ATEMPgross area sqm:
GROSSday:
DAYworkday:
W.DAY
Rolling sum
In Homepal, all metrics can be aggregated over a rolling time window. A rolling sum makes it easier to follow long-term developments.
Each metric can show a rolling sum over:
7 days:
R730 days:
R3090 days:
R365365 days:
R36512 months:
R12
Slice
In Homepal, every metric can be viewed through one or several slices.
A slice segments the data behind a metric, allowing analysis of a specific focus area.
Homepal includes both standard and custom slices.
Our standard slices are managed by Homepal to ensure industry consistency — enabling customers to share dashboard and report templates, and to benchmark focused metrics against each other.
Examples include:
Registered work orders >
External vendorsRent loss >
BlockedEnergy usage >
Heating
Slices are configured by your system administrator. They can be used by metrics, but belong to Entities→
Tips
Start small — activate just a few metrics first, then scale up as your team gets comfortable.
Make sure your organization has relevant slices set up so users can analyze targeted parts of data in a standardized way. Slices are managed under Entities→
Copyright © Homepal AB 2025