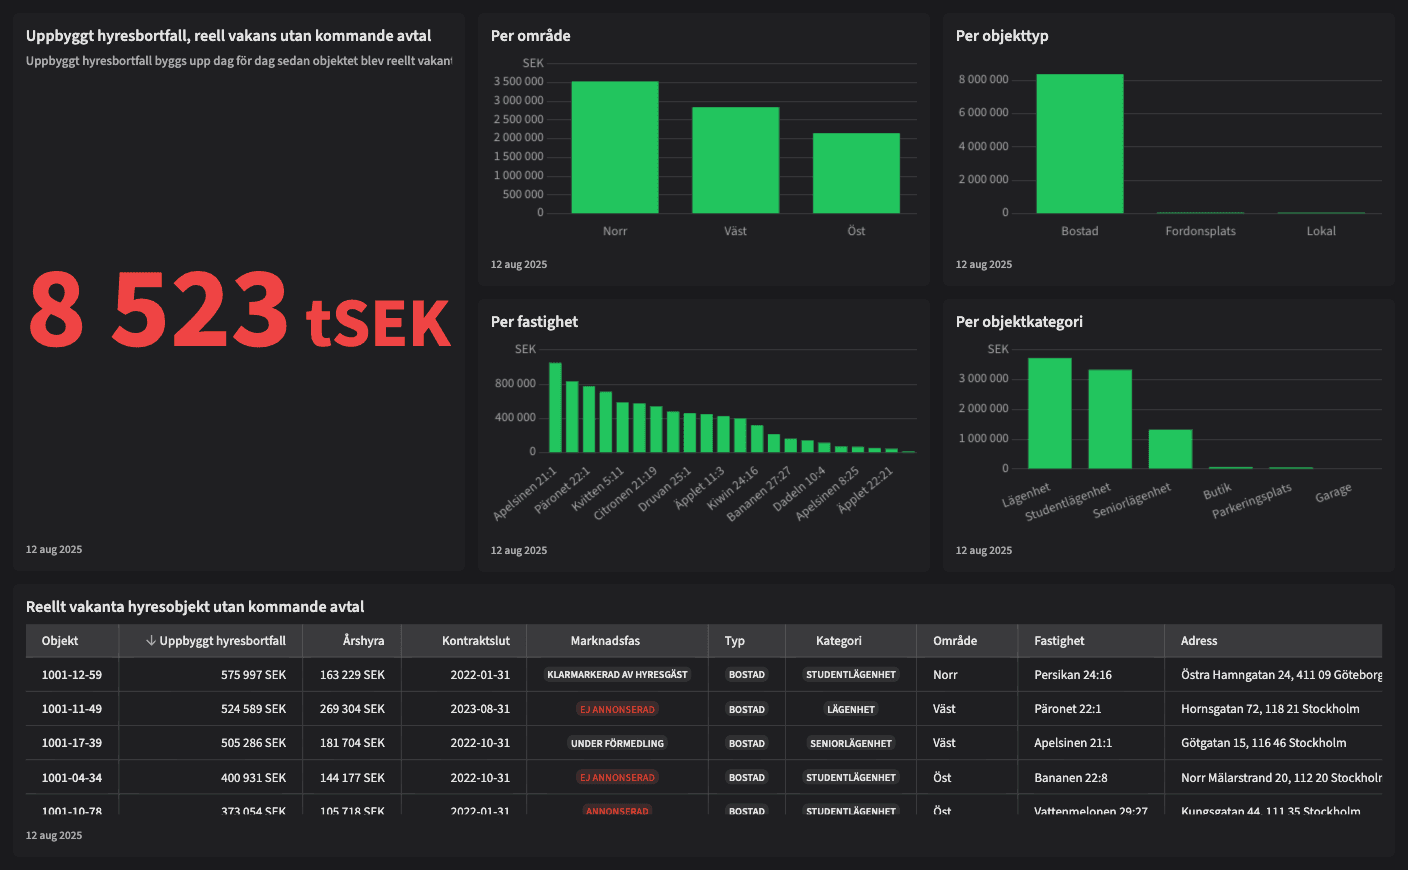
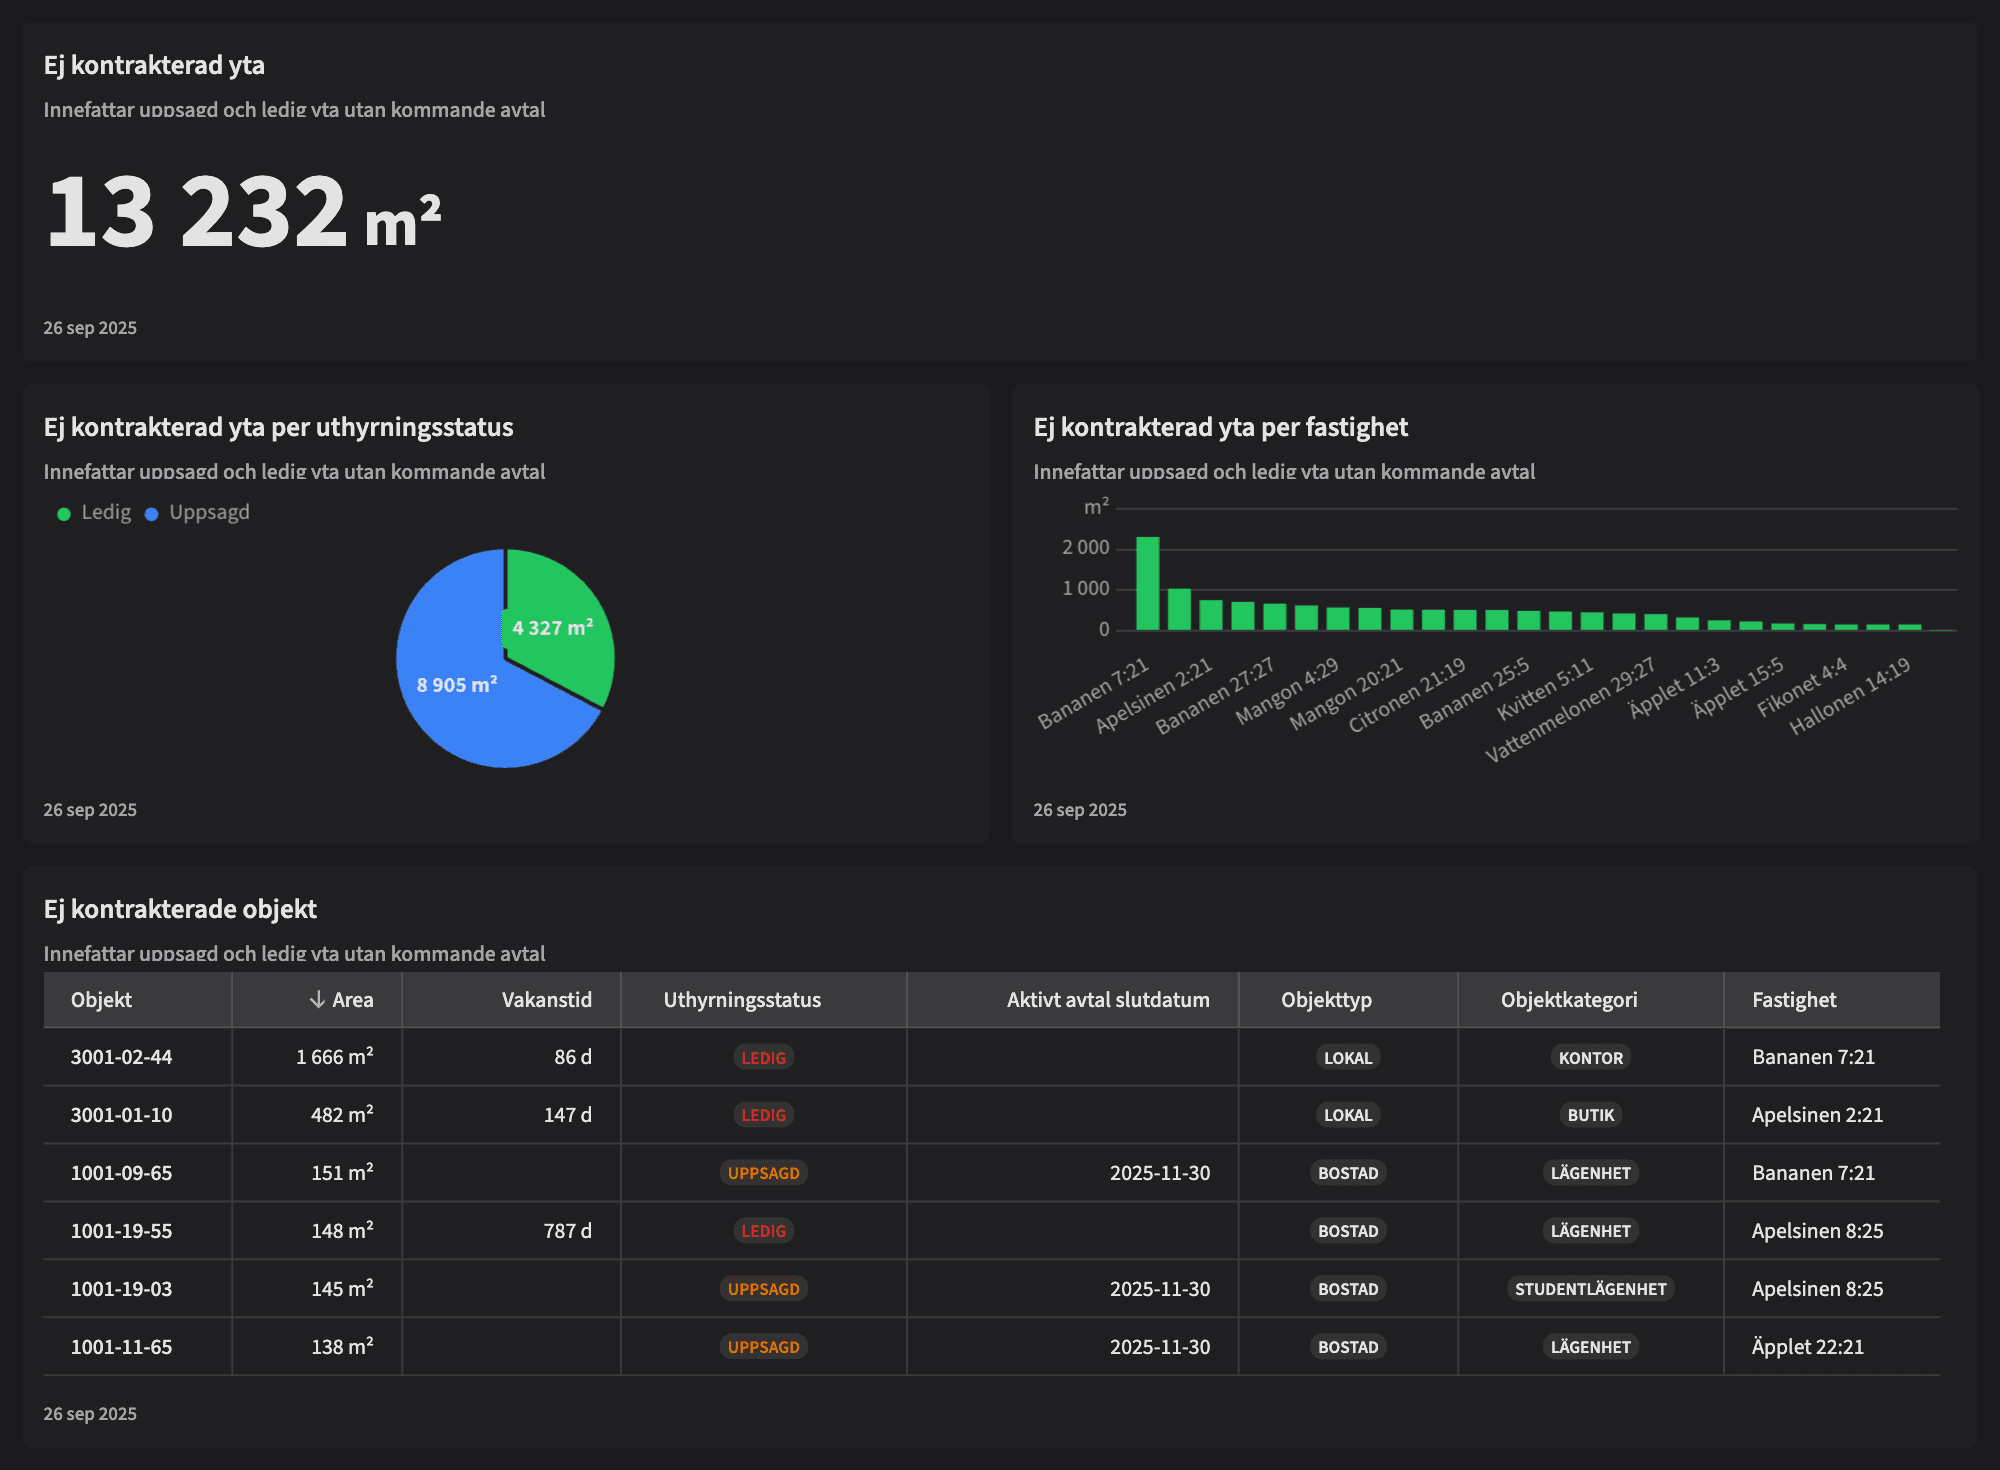
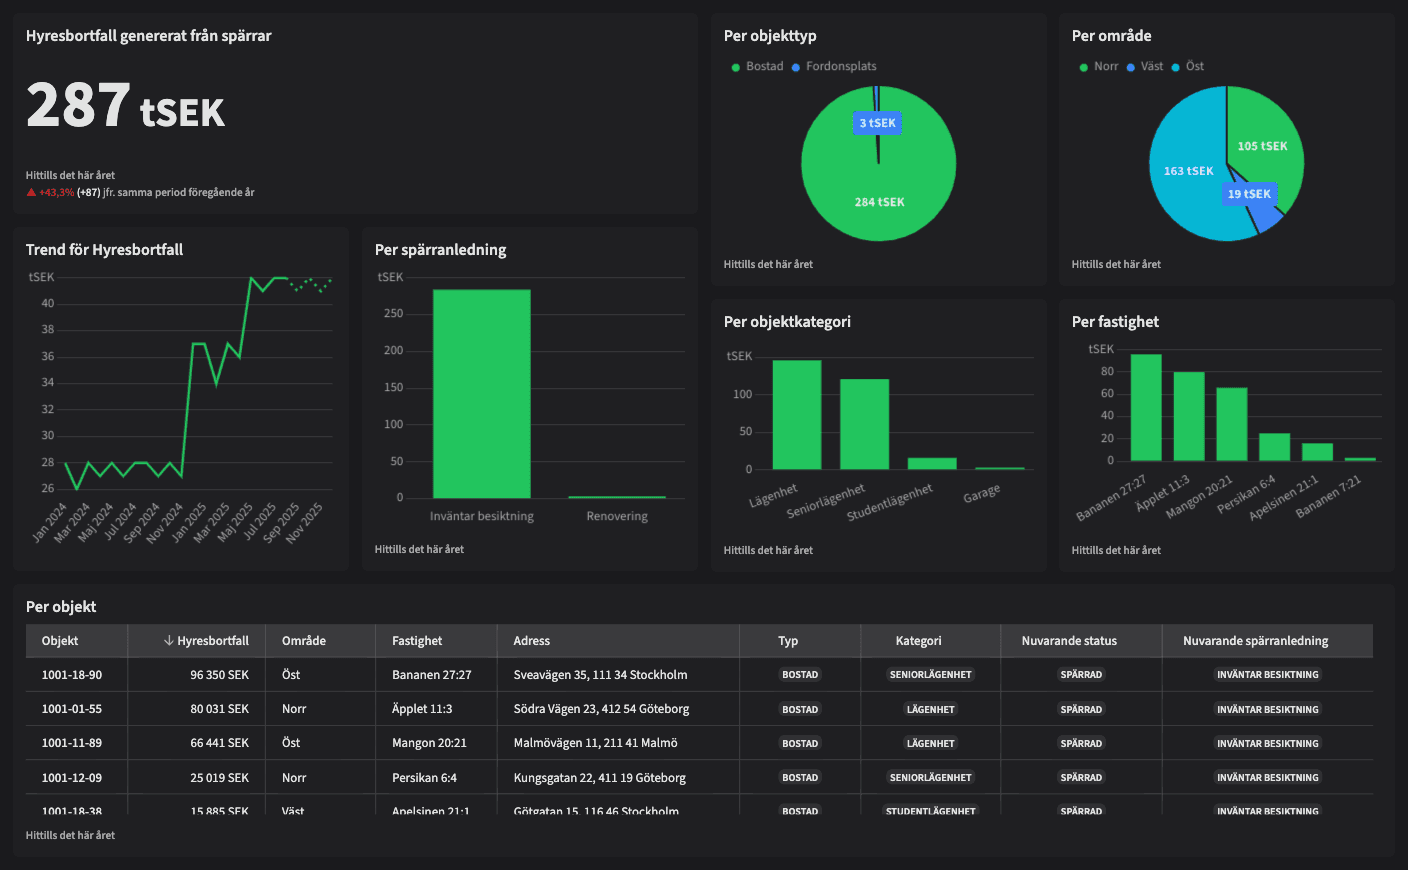
The dashboard provides a clear overview of total rent loss caused by units with an active block status over a selected time period. You can track the trend over time, identify which properties have the highest accumulated loss, and see which types of blockages have the biggest financial impact.
This dashboard helps uncover inefficiencies, excessive downtime, or structural delays that drive revenue loss. It serves as both an operational tool and a strategic resource – for example, when deciding which properties need intervention, extra resources or new workflows.
| Vem tittar på den? | Administrator, CEO, lessor |
|---|---|
| Hur ofta? | Weekly |
Tips!
Tips on what to focus on:
- Which properties have been blocked for long periods – and why?
- Are certain types of blocks (e.g. repairs, sanitation) linked to higher losses?
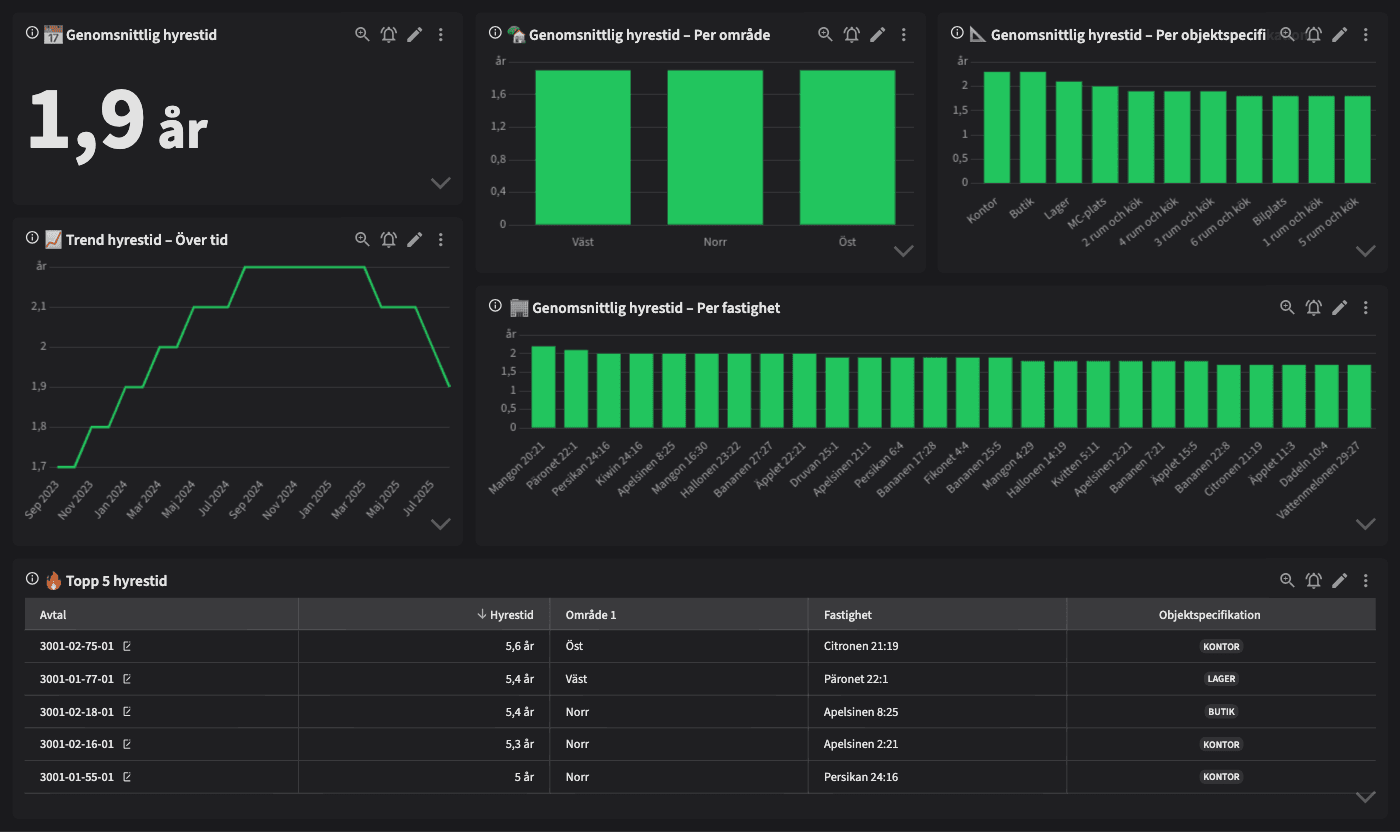
- Is the rent loss trend improving or worsening?
- How much of the total loss is concentrated in a few properties?
- Use the dashboard to guide technical planning and prioritization.
Exempel på anslutningar
Vitec Hyra & Teknisk förvaltning
Portfolio
Integrated module for rental administration and technical property management, handling lease contracts, work orders, maintenance, and day-to-day operations.
No permission to link.