When companies buy a traditional BI tool like Power BI, everything starts with… nothing.
What follows is usually:
- Workshop to analyze needs
- Requirements spec for data sources
- Consultant procurement
- Integration of the first system
- Data modeling
- KPI testing
- Visualizations in Power BI
- First dashboard
And by then, 3–6 months have passed. Sometimes more.
We flipped the process
When you choose Homepal, we don’t start from zero. We start with:
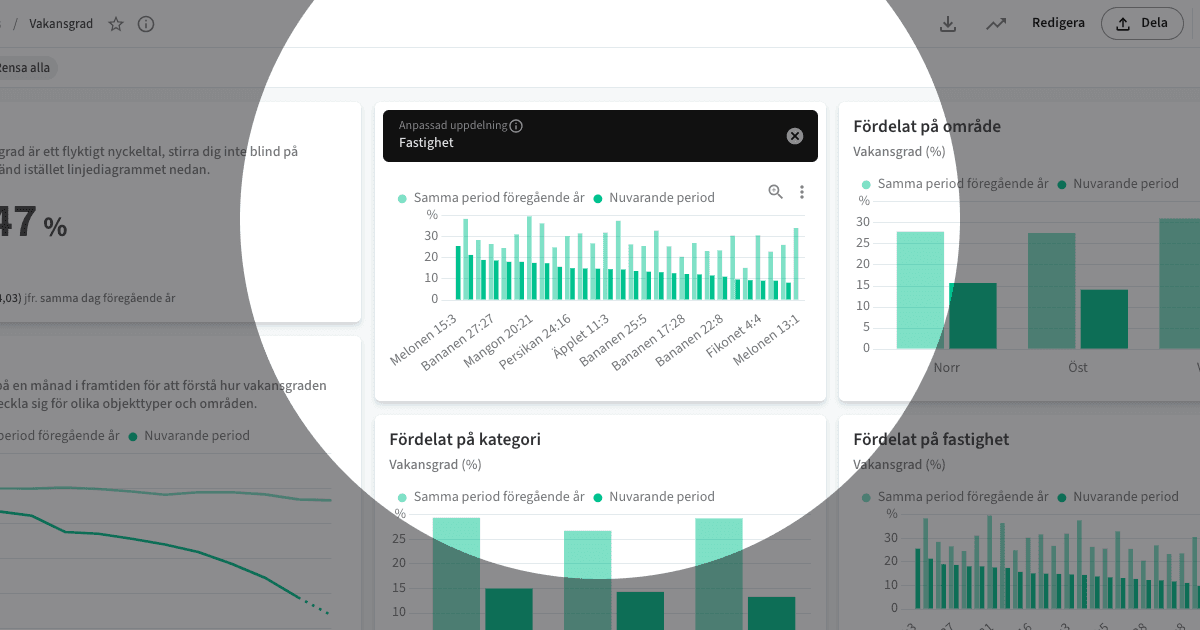
- 170+ pre-defined KPIs
- A complete data model
- Tested integrations
- An interface optimized for real estate
- Dashboard templates, filters, comparisons, and alerts
- Documentation in both Swedish and English
All you need to do is say yes. We connect – you start using.
This is the difference between BI as a product and BI as a project
With Homepal, you don’t need to:
- Assemble a project team
- Schedule workshops for “needs gathering”
- Wonder what’s possible to measure
- Learn how the data model works
- Order consultant hours for every new visualization
We’ve already done that work – once, for all customers. So every new customer gets access to world-class BI from day one.
It’s fast because it’s ready – not because it’s simplified
This is important. What we deliver is not an MVP, a prototype, or a “version 1” – it’s a full-scale BI solution for real estate companies. The only difference is: we built it in advance.
That’s why you can:
- Log in on day 3
- Start working on day 4
- Make better decisions by day 5
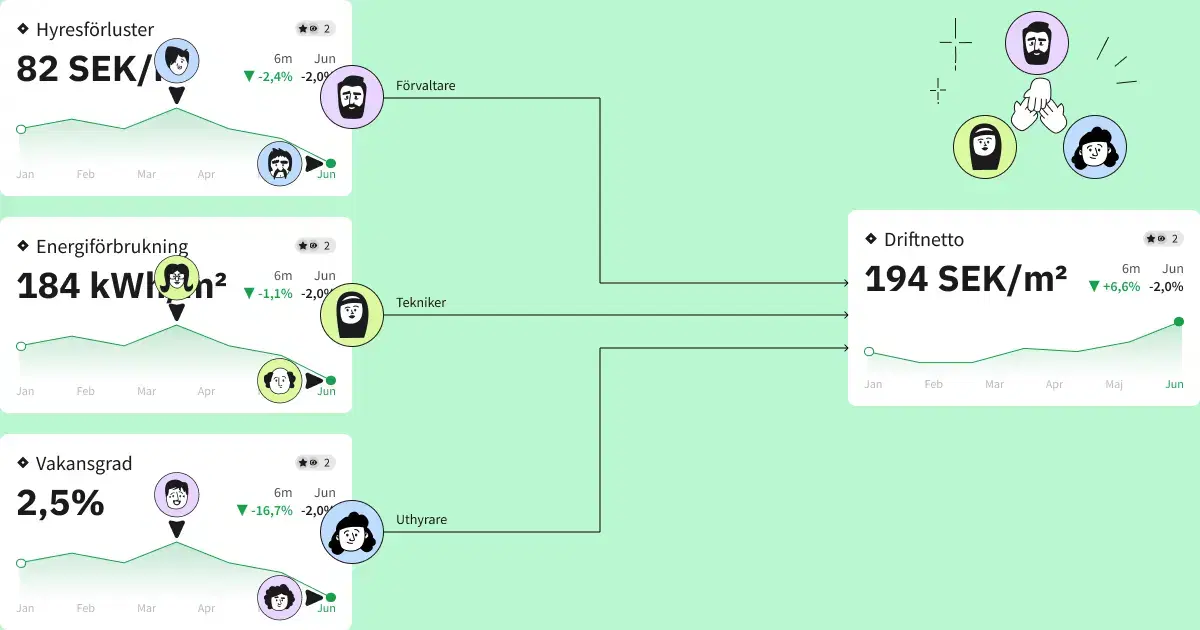
Example of what might happen in your first week:
- You see which units had the most blockings over the past year
- You realize pre-inspections aren’t being booked on time in some areas
- You compare leasing speed across different housing types
- You discover that interest in certain apartment types has shifted
And the best part? You didn’t have to ask anyone to find it.
Next time we’ll show how a single KPI can transform an entire workflow – with real-life examples: