One of the most common questions we get is:
“How many KPIs are included in Homepal?”
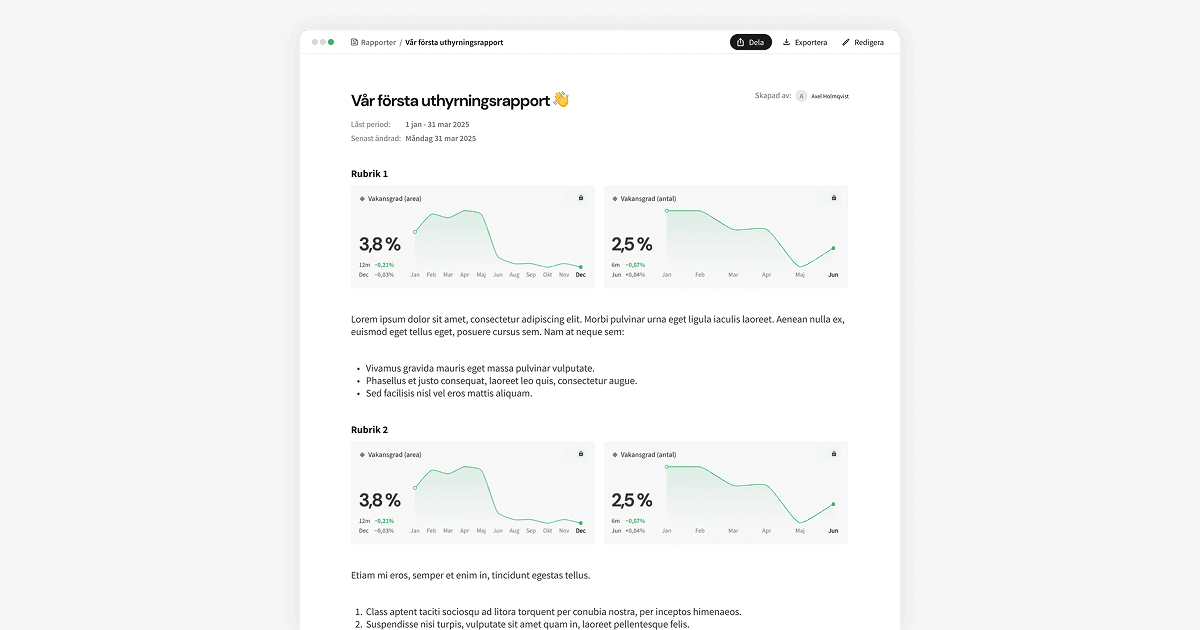
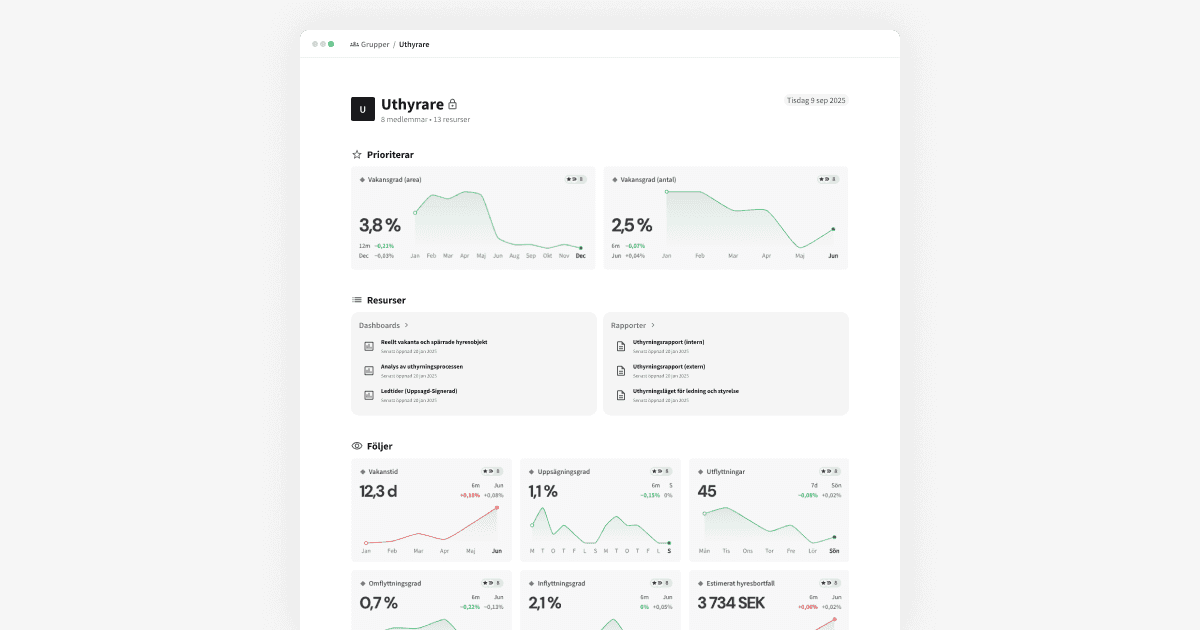
The answer is simple: We currently offer over 170 pre-defined KPIs—built for the real estate industry, quality-assured, documented, translated, and ready to use out of the box.
But the real point isn’t how many KPIs we have. It’s what they represent.
KPIs in BI are usually a craft
In traditional BI, KPIs are something you build from scratch. Someone has to define it. Someone has to model the data. Someone has to create the metric in the tool. Someone has to document it. Someone has to QA it.
The result is:
- slow
- expensive
- hard to maintain
- and often dependent on a single person
And in the end, no one really knows what’s being calculated—or how.
In Homepal, KPIs are a product
We’ve done the opposite. We treat every KPI as a product component—with the same care as a feature in an app.
For every KPI, we’ve defined:
- what it means
- how it’s calculated
- why it matters
- which fields it’s based on
- how it should be visualized
- and how it can be filtered
When a new KPI is ready, it’s published to all customers automatically—ready to activate with a single click.
That’s how we can launch new KPIs every week
Our product team works every week to build new KPIs - based on:
- customer feedback
- industry changes
- new legislation
- new data sources
No pre-study. No requirement spec. We add. You use.
And that’s why you don’t have to worry about:
- Whether the data is sufficient
- Whether the fields are correctly linked
- Whether you need to consolidate multiple sources
- Whether the model can handle more calculations
We’ve already solved it. So you can focus on making better decisions.
Summary:
BI isn’t about being able to create KPIs. It’s about having the right KPIs—available, standardized, and understandable—when you need them. That’s why our KPI library is Homepal’s true competitive edge.
Next time we’ll dig into the question “what is a KPI, really?”—and why it takes more than dividing one field by another in Excel: